
The S&P500 has not hit the “20%” mark for a market correction but we have hit 14% drop since our last market high for the year. I wanted to provide you some analysis and commentary but ultimately we will want to remain patient and not attempt to time the stock market.
Early in the Year Market Declines “Feel” Worse
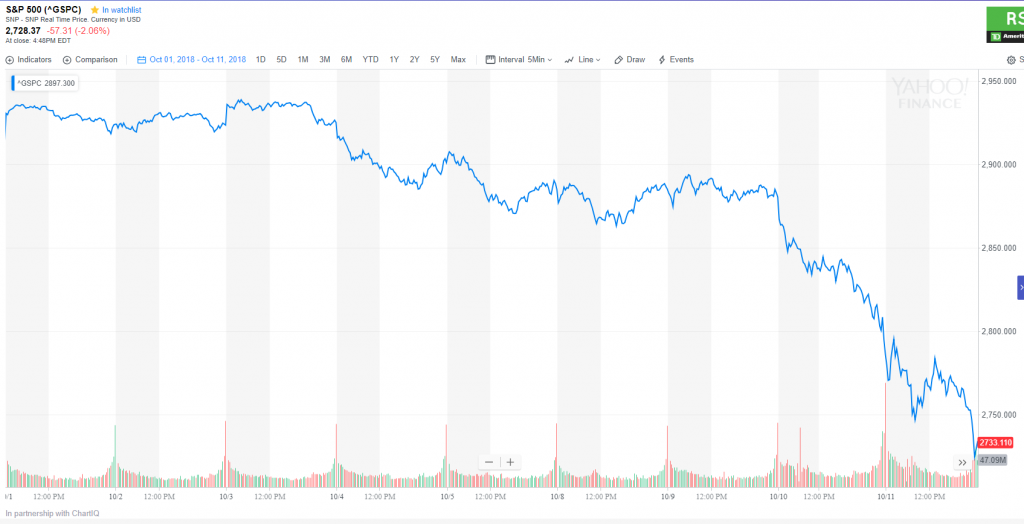
As of 5/5/2022, we are down 14% from our market high for 2022 and today (5-9-2022) is starting out rough as well. This decline feels more painful when it occurs at the beginning of the year vs later in the year. For example, 2018 saw a 20% decline most of which occurred in the last few months of the year. The market ended up down 6% in 2018 but most investors did not “feel the pain” as much as we do when the drop occurs early in the year.
Investors often feel that when January 1st hits, the returns earned previously are somehow “banked”, so a drop in the beginning of the year often causes more anxiety than a drop later in the year. When investors see a drop later in the year, they seem to feel some of that drop is “the house’s money”. We realize the fact that a loss is a loss regardless of when it occurs, but it is also important to understand this is human nature. It is perfectly normal for market declines earlier in the year to psychologically impact us more than declines later in the year.
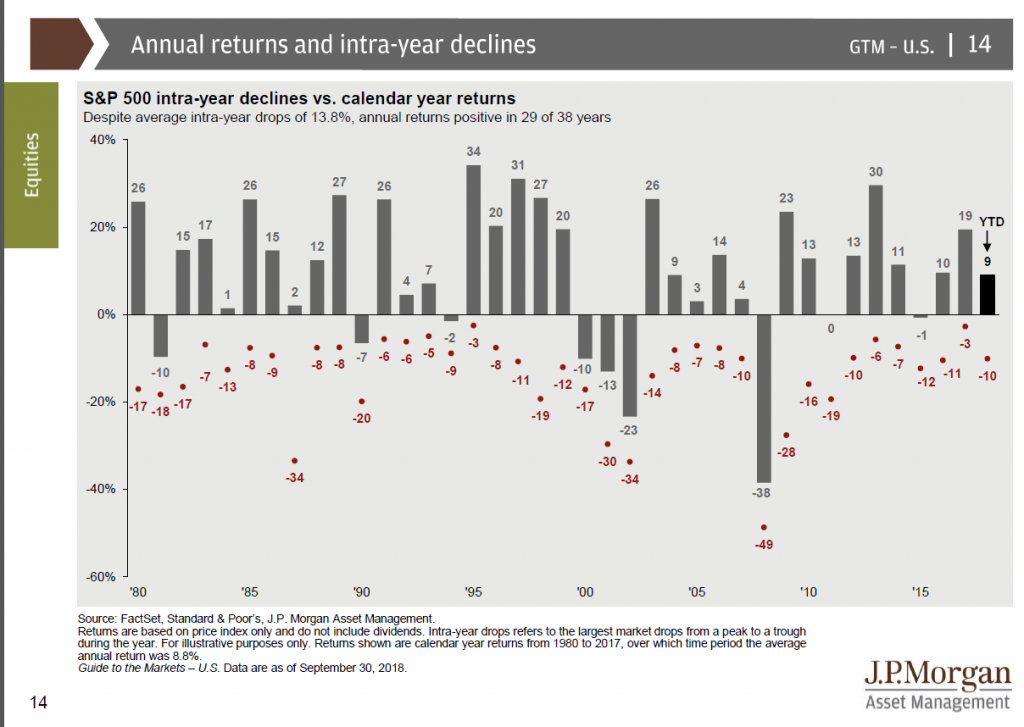
How much does the market drop on average?
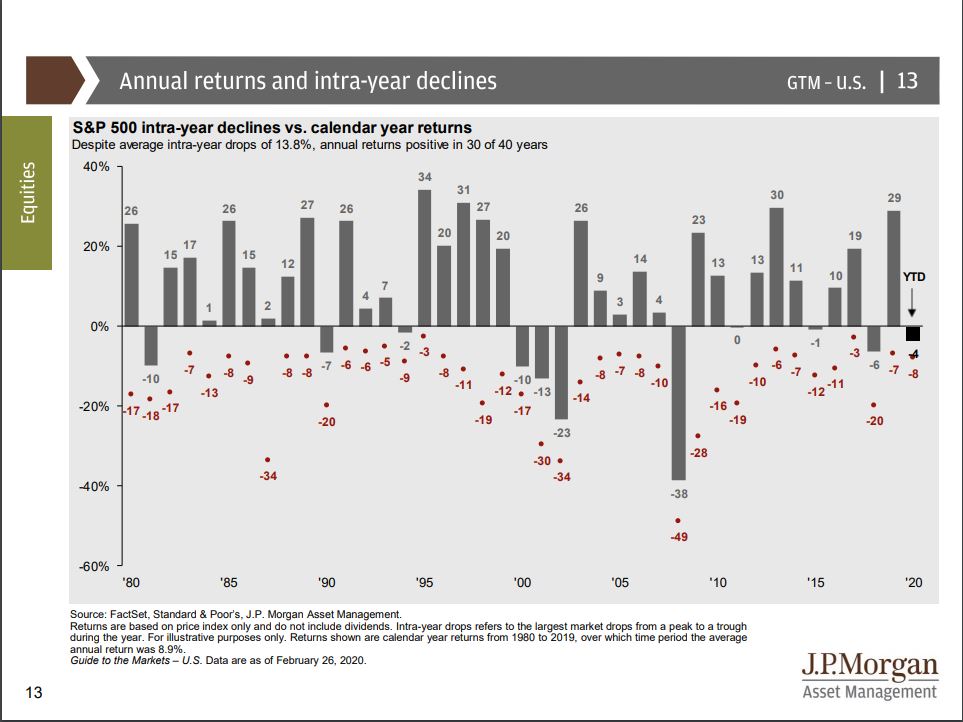
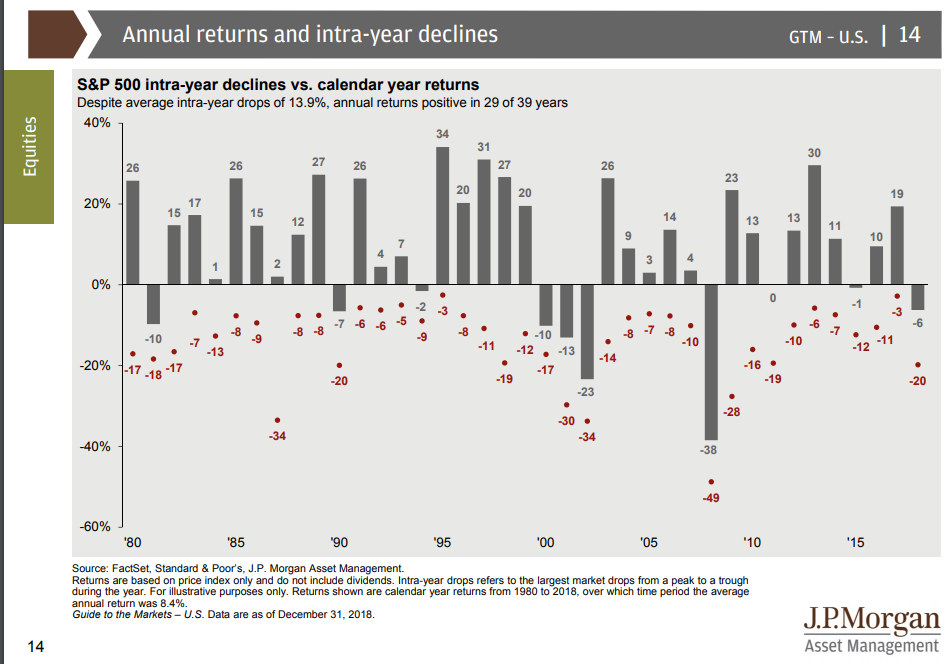
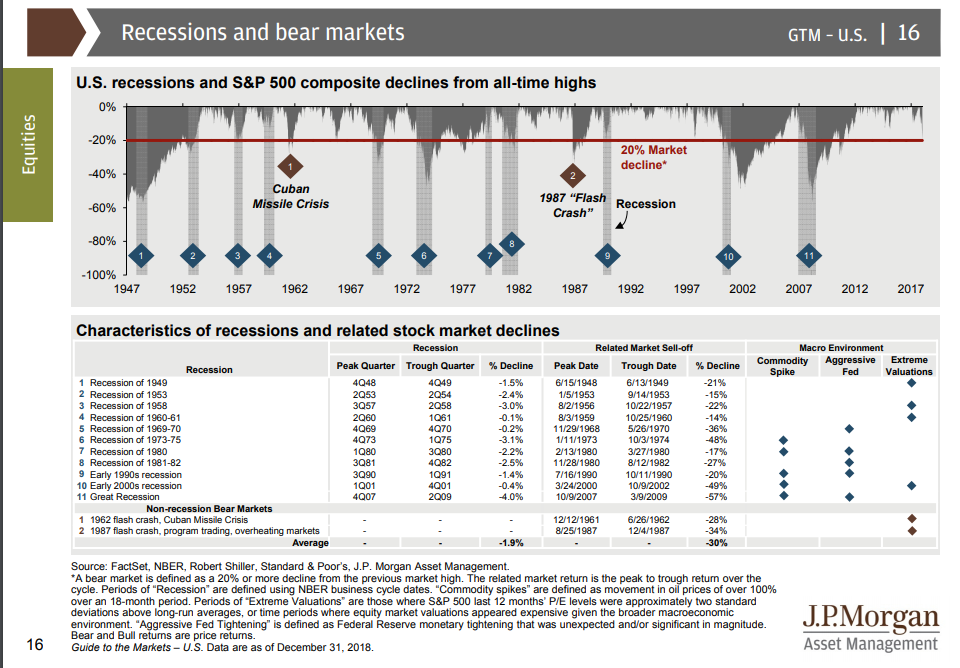
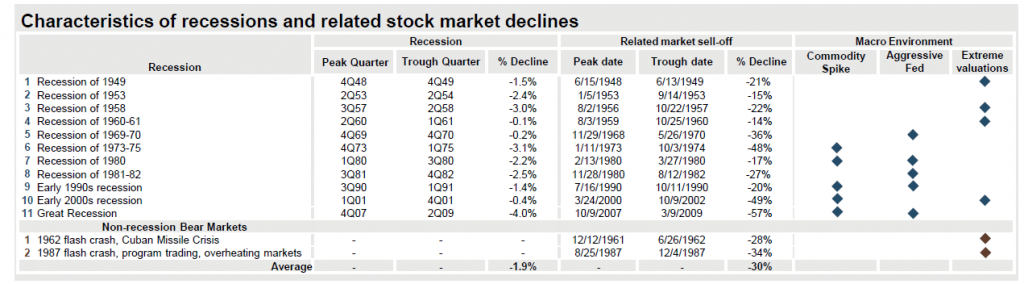
According to JP Morgan’s excellent “Guide to the Markets”, the market decline’s 14% on average in the last 42 years. The market still ended the year positive in 32 of 42 years.
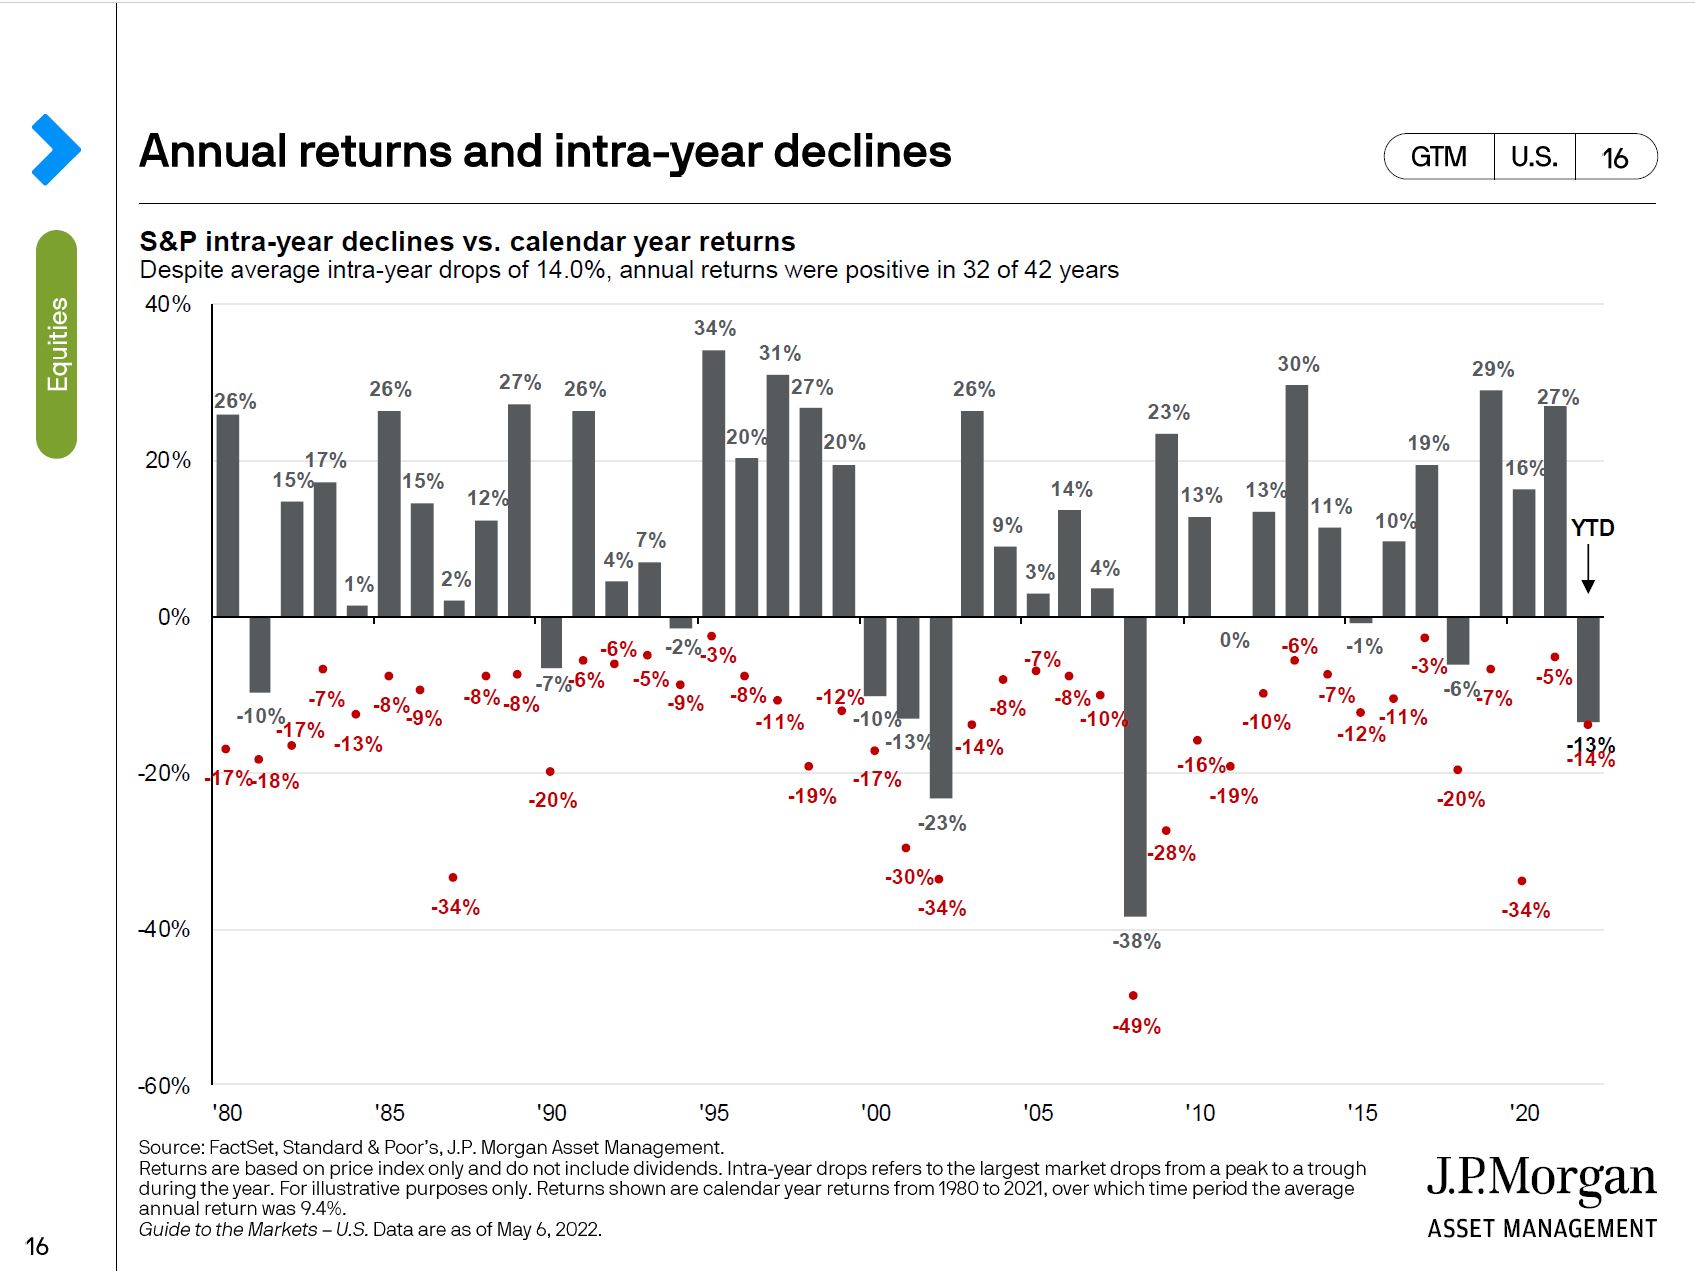
Perhaps one of the greatest examples is the decline in 2020 where the market dropped 34% in only a couple month when the pandemic hit. The market then proceeded to rebound rapidly to finish the year up 16%. Investors that sold even at half way down at 17%, still lost significant upside trying to time the market.
Is this time different? People around me seem really pessimistic?
Interestingly enough, pessimism tends to be good for stocks. If we look at this chart:
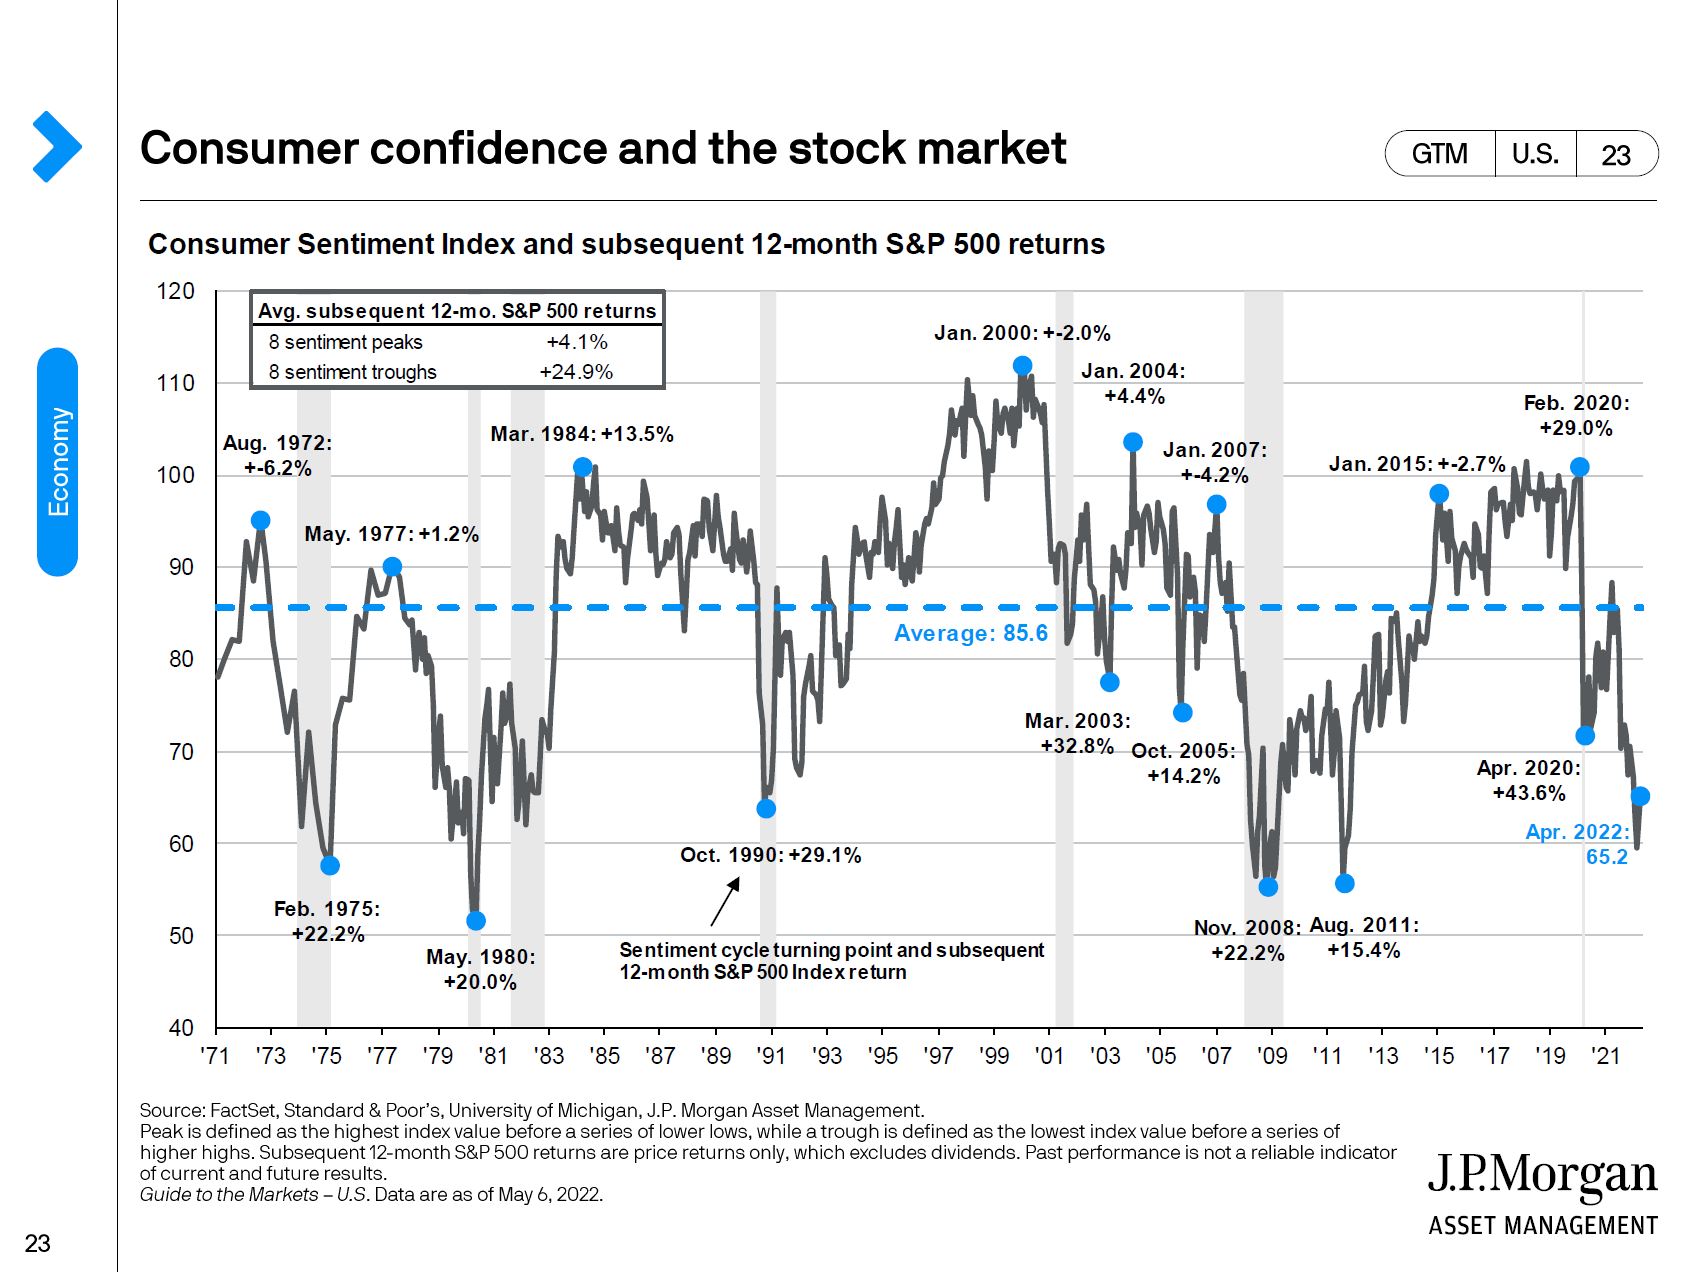
According to the chart above, below average consumer sentiment is a good indicator for better future returns. The logic playing out here is that markets continue to drop as people/investors feel worse about the future. Once all the negativity and selling pressure has run its course, the market then can then rebound. One interesting thing to note is that sentiment is worse than even April of 2020 when the pandemic hit.
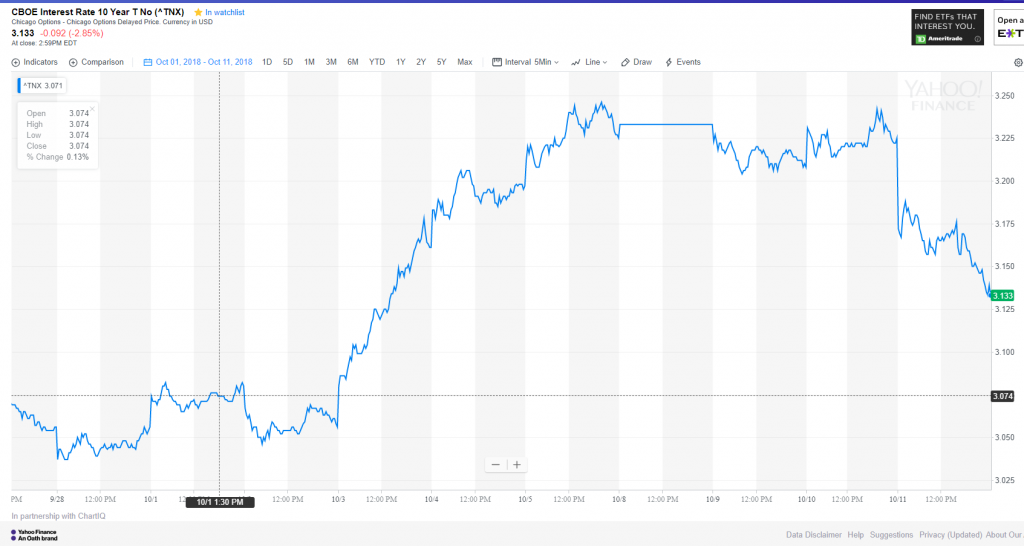
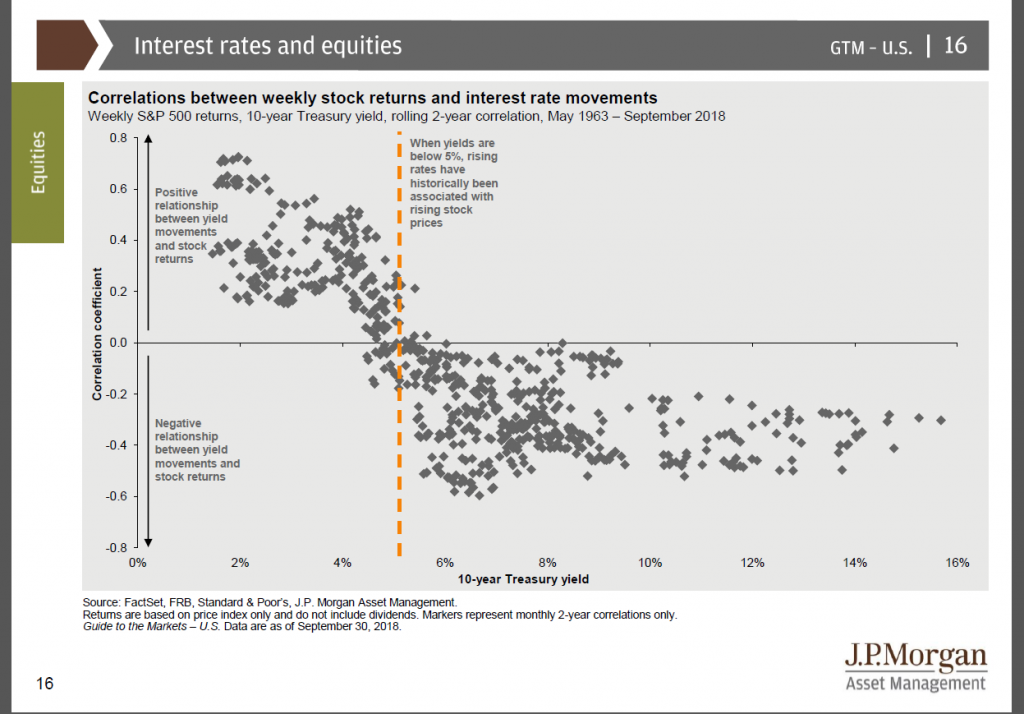
Rates are rising, Does that mean the stock market will tank?
Its possible but one of the interesting data points to look at is the following:
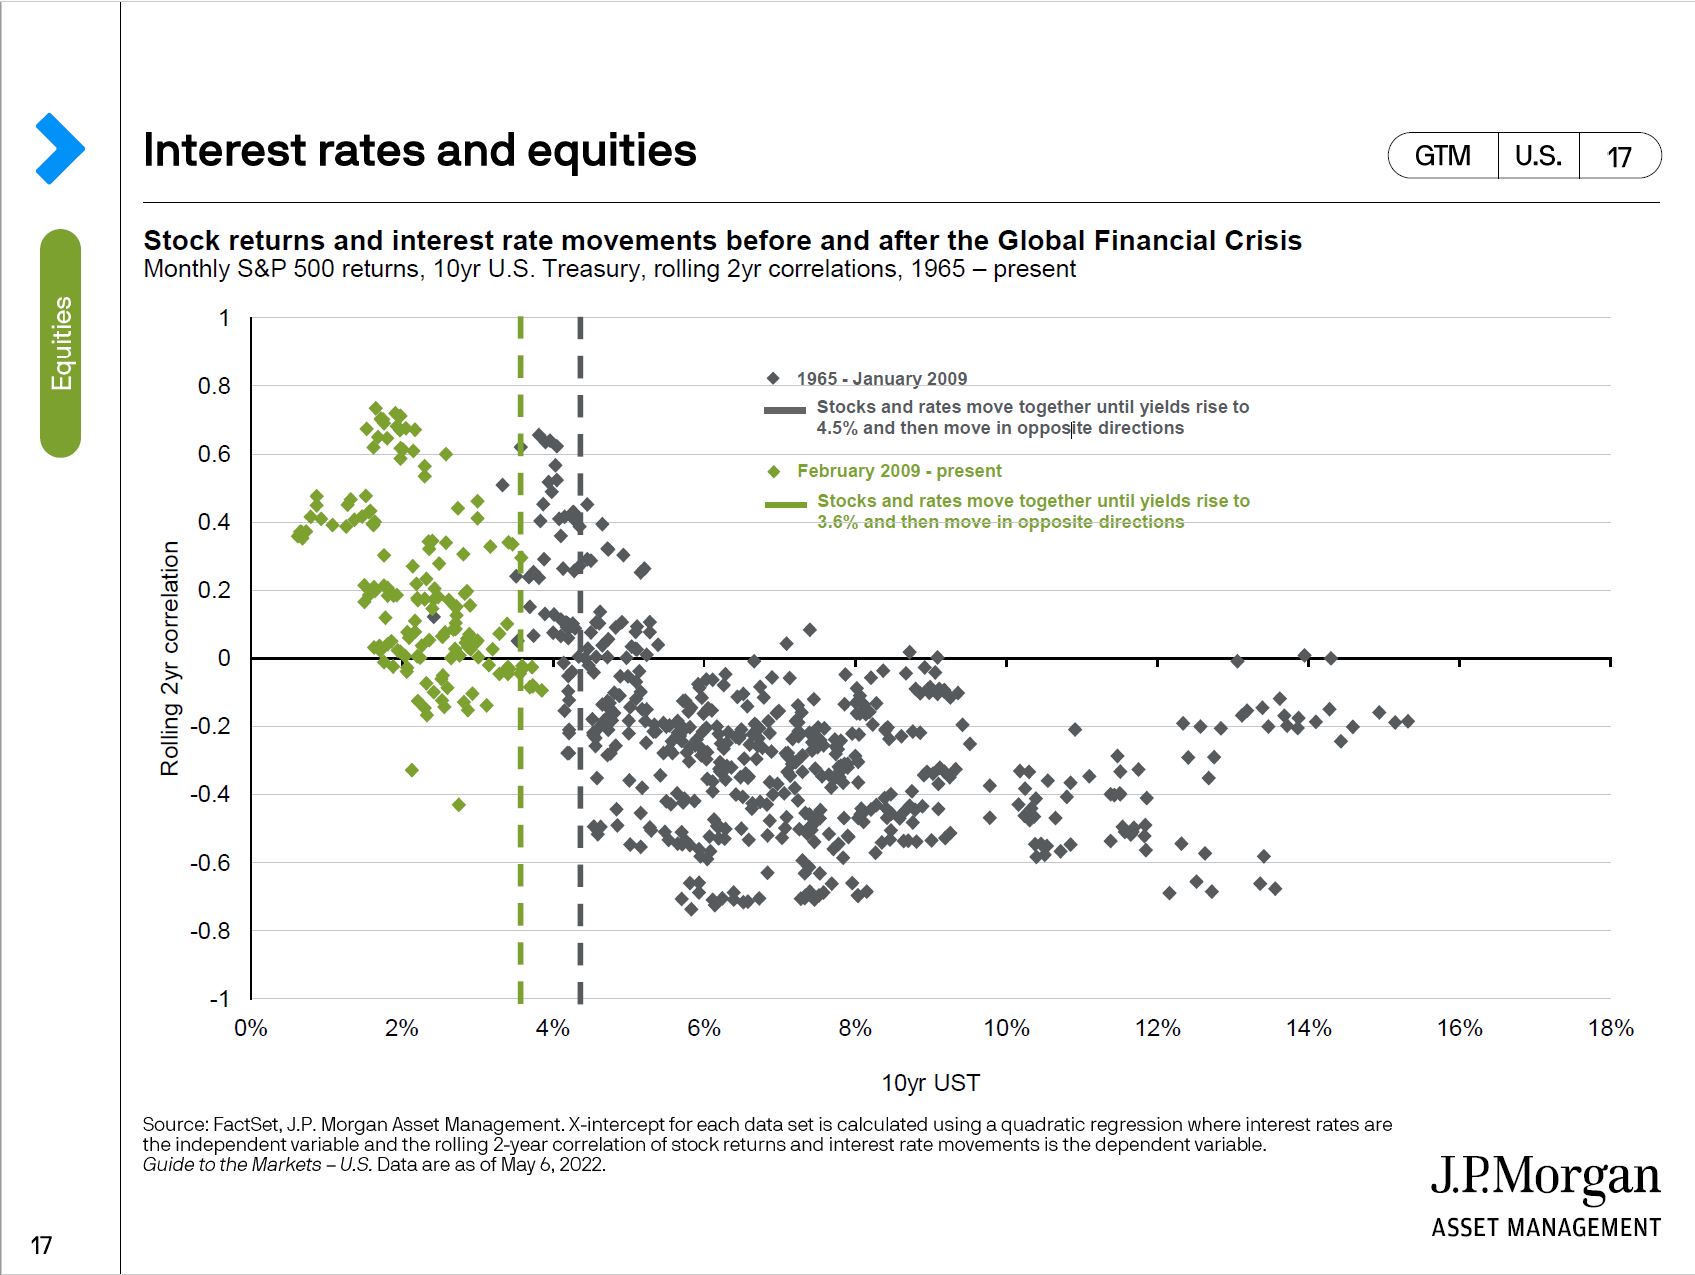
A few things jump out at me about this chart. The first is that stocks have done well when rates were rising as long as the total yield was relatively low (3.6% since 2009 and 4.5% from 1965-2009). Currently, we are at around 3% for the 10 year bond. If we think the past 13 years or past 55 years are any indication, the current rising rates on the 10 year bond should not choke off stock market growth.
Further, we can look at past rate hike cycles:
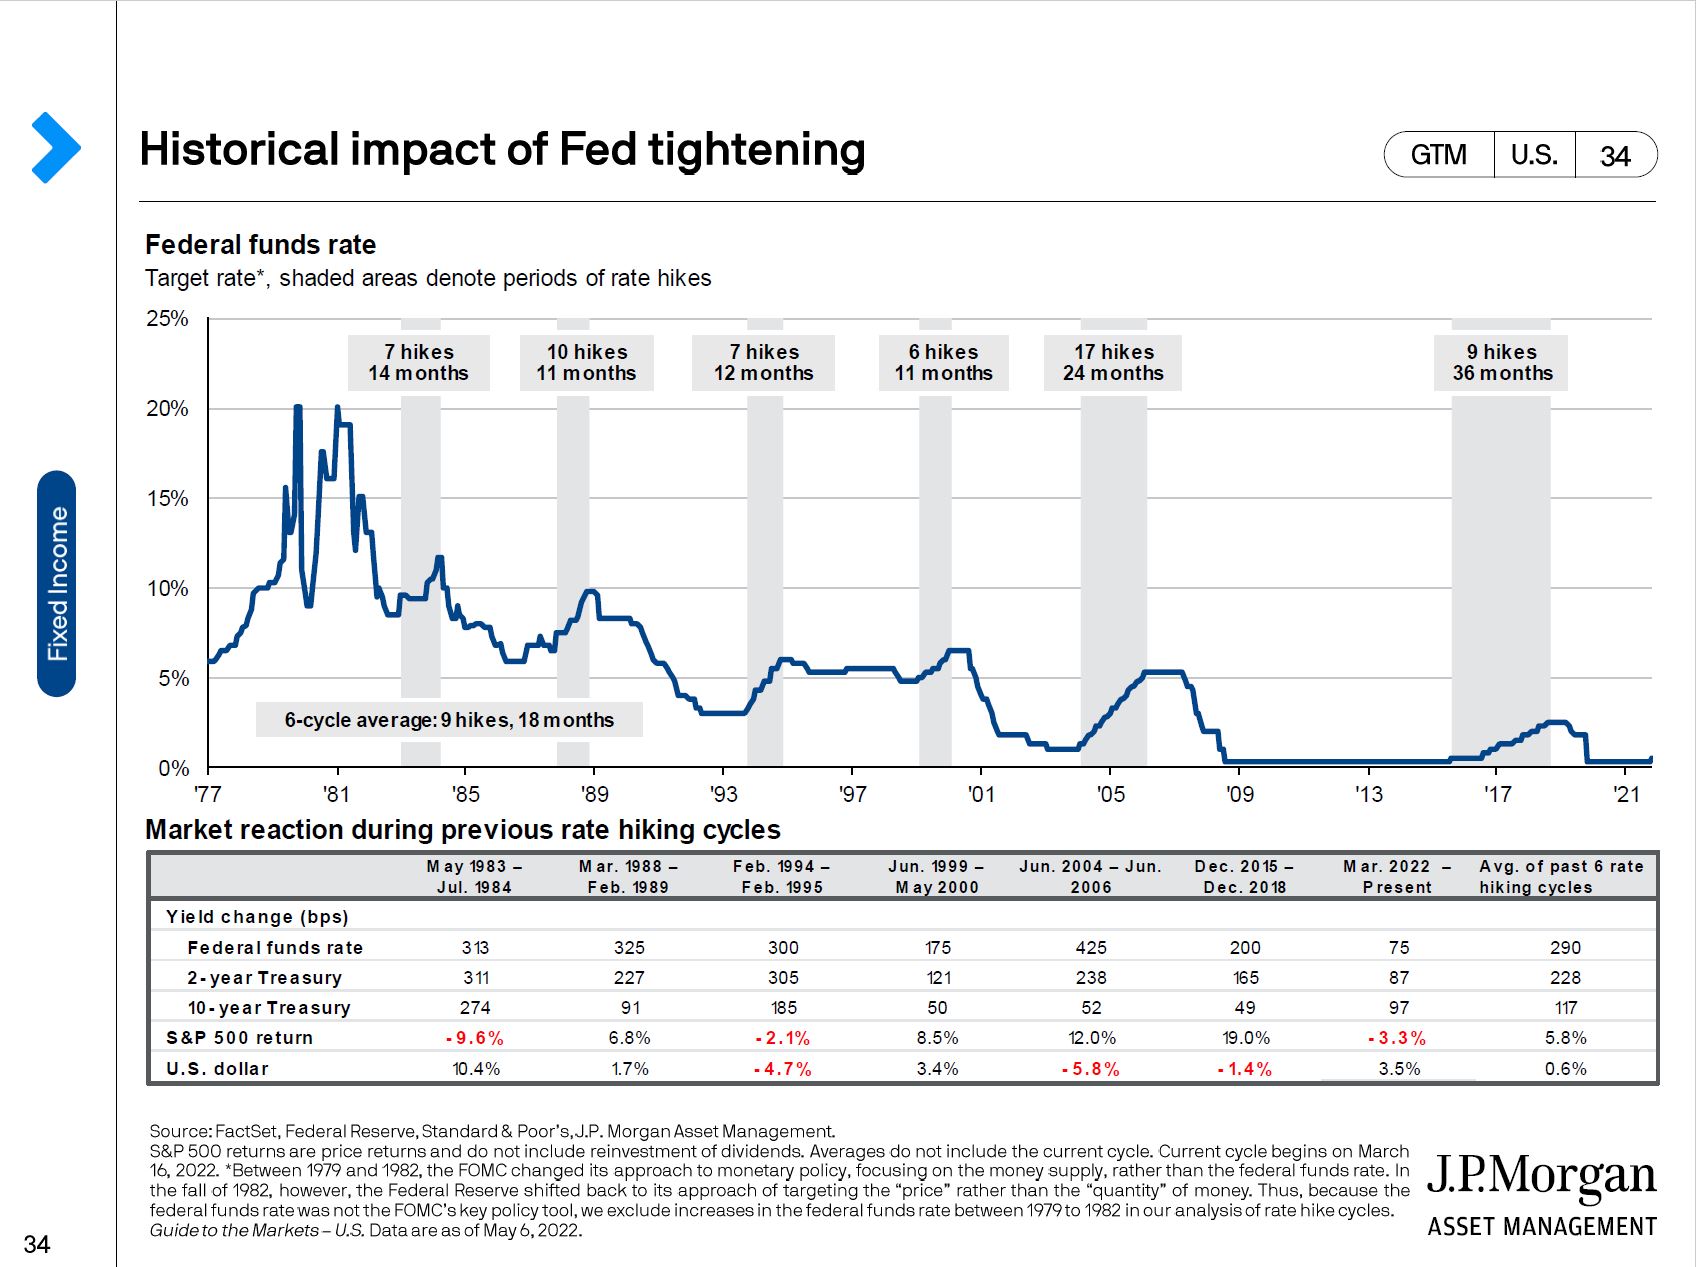
If we look at the past 7 rate hike cycles, the market on average ended up 5.8% and ended up positive in 4 out of 7 cycles. The moral of the story: there is not a convincing enough argument to try to time the market based on Fed tightening.
What about the “I” word…… Inflation?
Inflation has roared ahead dramatically since mid 2021 with the most recent numbers from March of 2022 being 8.6%.

While food and core CPI are higher than the 50 year average, energy has been dramatically higher at 32%. Energy is notoriously volatile but current pace is increasing quickly. While energy inflation is a concern. The biggest concern from the Fed when they raise rates are wages.
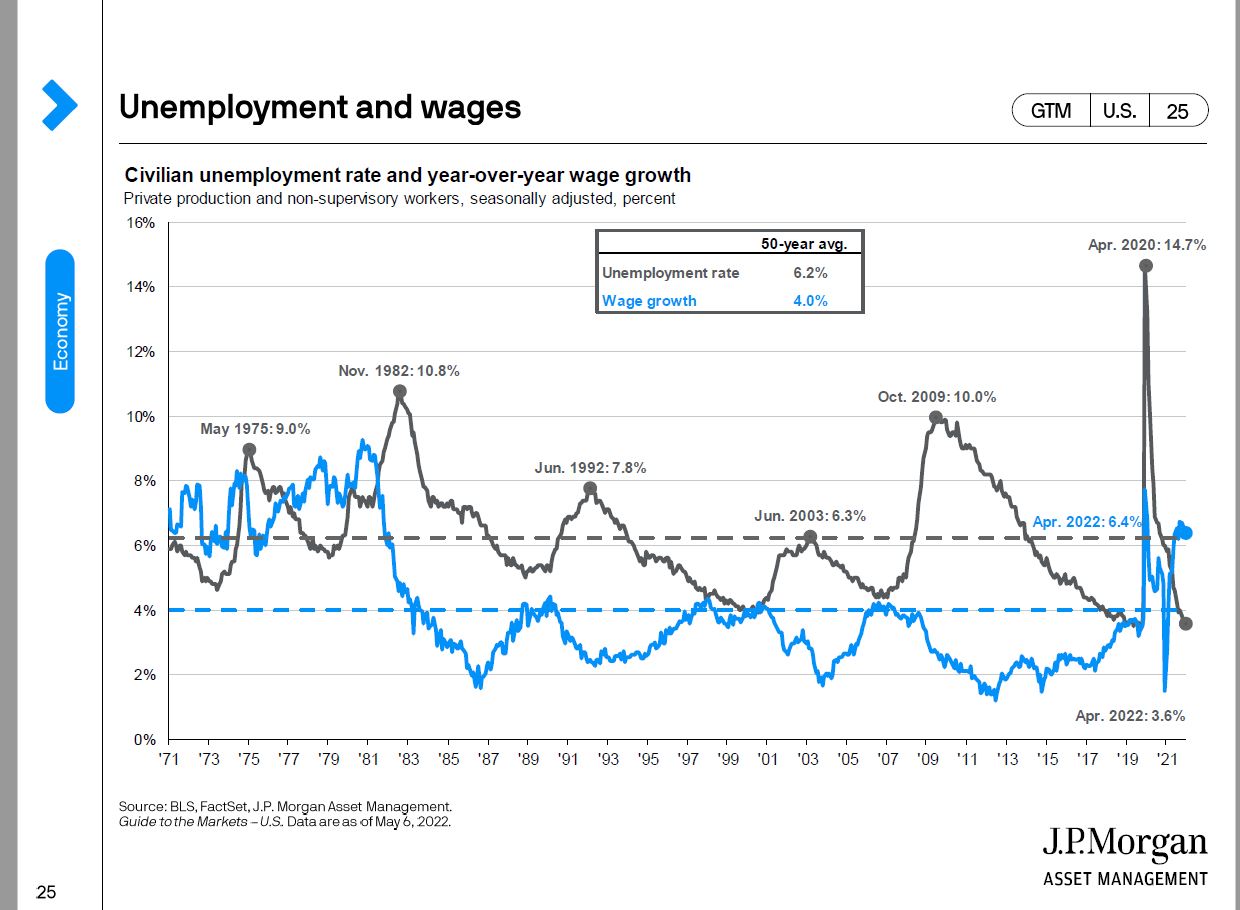
Unemployment is the lowest it has ever been. Wonder why McDonald’s is advertising for jobs in the drive thru? They are desperate for help. The lack of labor available has caused a run on wages with wage growth growing very quickly.
The Federal Reserve is the most concerned about historically low unemployment and wage pressures more than other items affecting the inflation.
The Federal Reserve has a dual mandate. The Fed reserve seeks to keep unemployment low and keep prices stable. Currently, we have prices increasing rapidly with ultra low unemployment.
Do not let the short term ruin your long term investing plans
This mantra has been my consistent advise to clients that have worked with me over the years. It is very challenging but we need to make sure we do not let short term movements affect our long term plans. I will leave you with a few charts to explain why we need to stick it out with our long term plans.

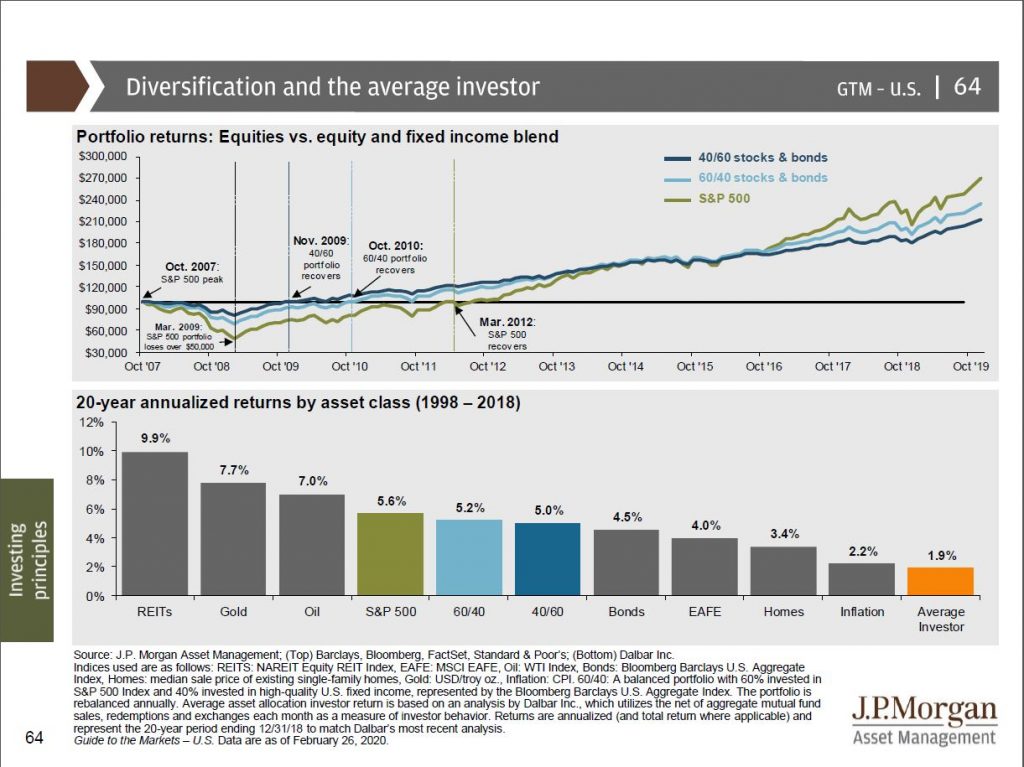
The average investor (many of which have investment advisors) have underperformed nearly every asset class. How does that happen? Investors try to time the market and jump in and out of different investments at the wrong time. Had the investor simply picked ANYTHING other than commodities, they would have performed better. Moral of the story, stick with our plan and try not to time the market and jump to the latest fad.
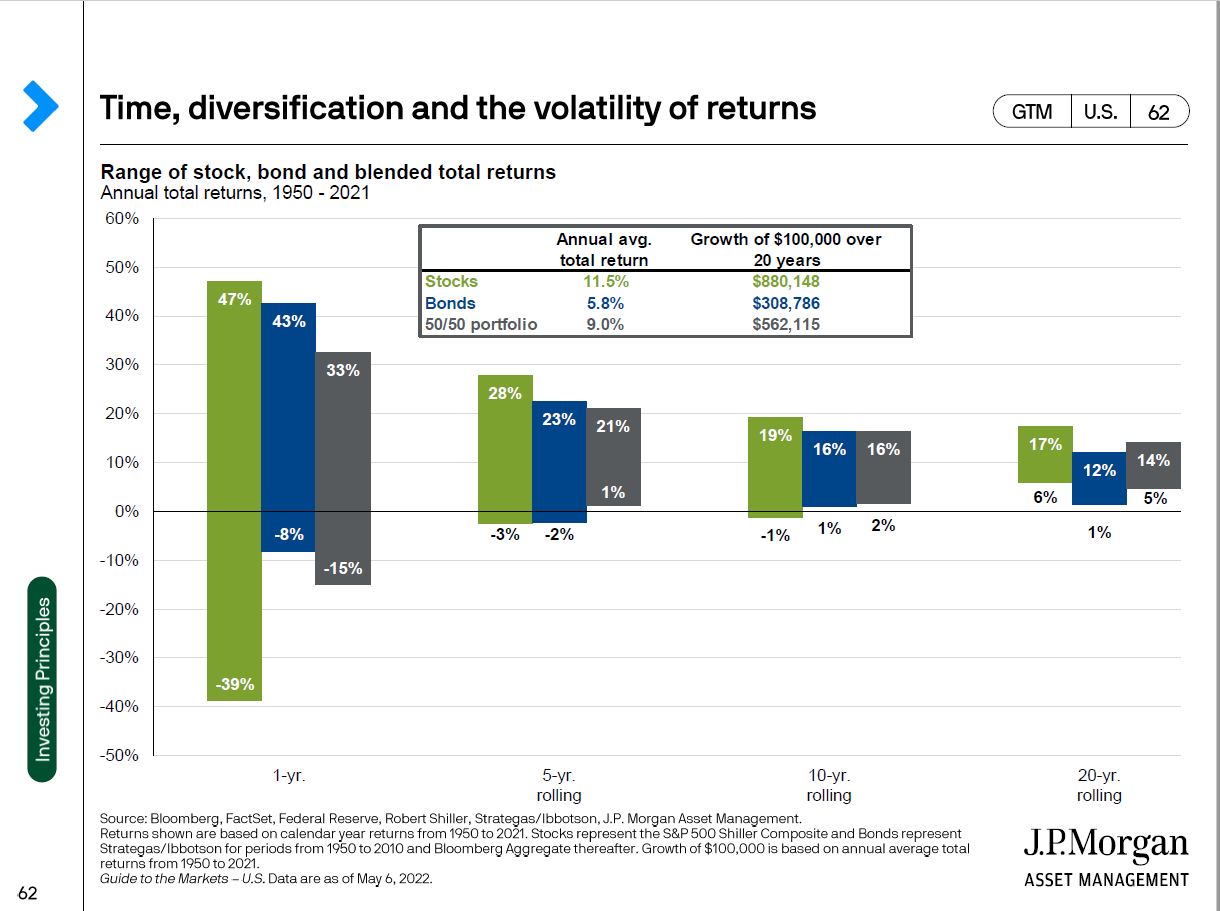
As can see from the above chart, our greatest ally is time. We need to be patient and let the 5 and 10 year returns reward us. Diversified portfolios over 5 and 10 year periods are overwhelming positive. While past returns do not guarantee future results, I do think the wise investor should find comfort in their long term goals matching with the markets long term returns.
Ultimately, we need to stick to our long term plan. It will be nearly impossible to time the next big drop in the stock market. Should we try, we are more likely to make the call incorrectly and hurt our long term returns. Attempting to time the stock market is similar to the old “Siren’s song” longing boats to veer off course and into trouble. I remain vigilent and will continue to position our portfolios to withstand market jitters and help us reach our long term goals. If you have any questions, please do not hesitate asking.
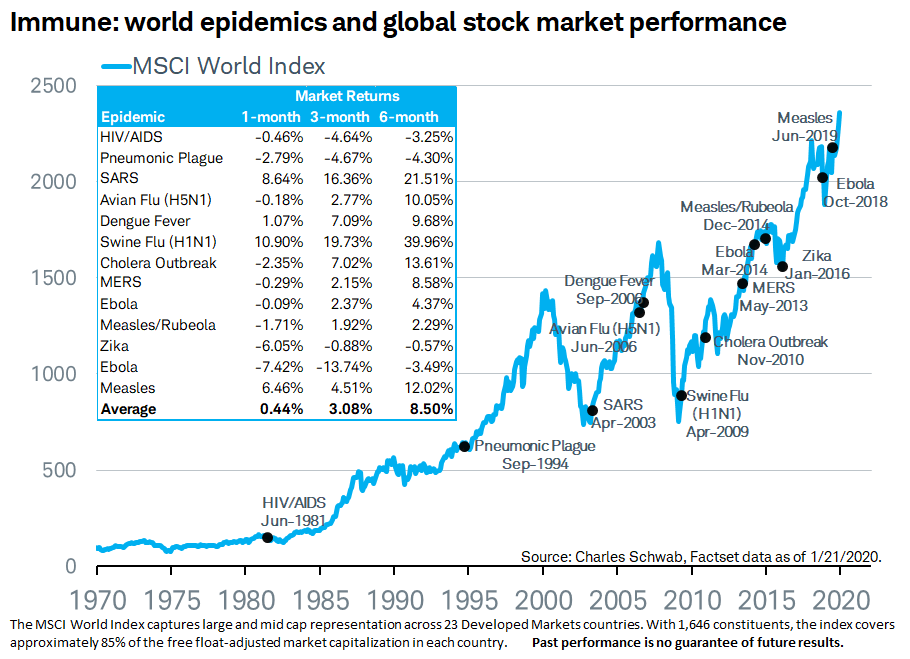
I will leave you with the last few times we had similar articles to reassure you that these drops are common and more times than not, they are not signs of worse things to come.
PLEASE DO NOT HESITATE CONTACTING ME IF YOU HAVE ANY QUESTIONS.
** The information on this website is intended only for informational purposes. Investors should not act upon any of the information here without performing their own due diligence. Reh Wealth Advisor clients should discuss with their advisor if any action is appropriate.
Alot of the slides were take from
https://am.jpmorgan.com/us/en/asset-management/gim/adv/insights/guide-to-the-markets