2018 Stock Market Jitters – Time to Panic or Relax?

2018 Stock Market Jitters


Market Jitters have returned.  It has been a long time since we have had a measurable pull back in the markets.  This past week we have seen the market quickly pull back.  This time is feeling a lot like 2015.  For my clients that were with me then, this market pull back will likely feel familiar.


This post is going to be a review of the last pull back and what we wrote in 2015.  I will be updating data and writing a similar article this time.  The cliff notes version is that this pull back is most likely a pull back and not a recession.  It is possible this time will lease to a recession, however,  the “odds” are in the favor that it’s simply a pull back.  At some point, we will have a pull back that turns into a recession but we are unlikely to know until after the fact.


Stock Market Pullback a Time to Reflect (Article from August 24, 2015)

This article had some key points.

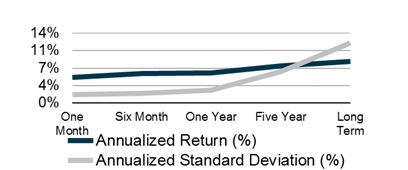
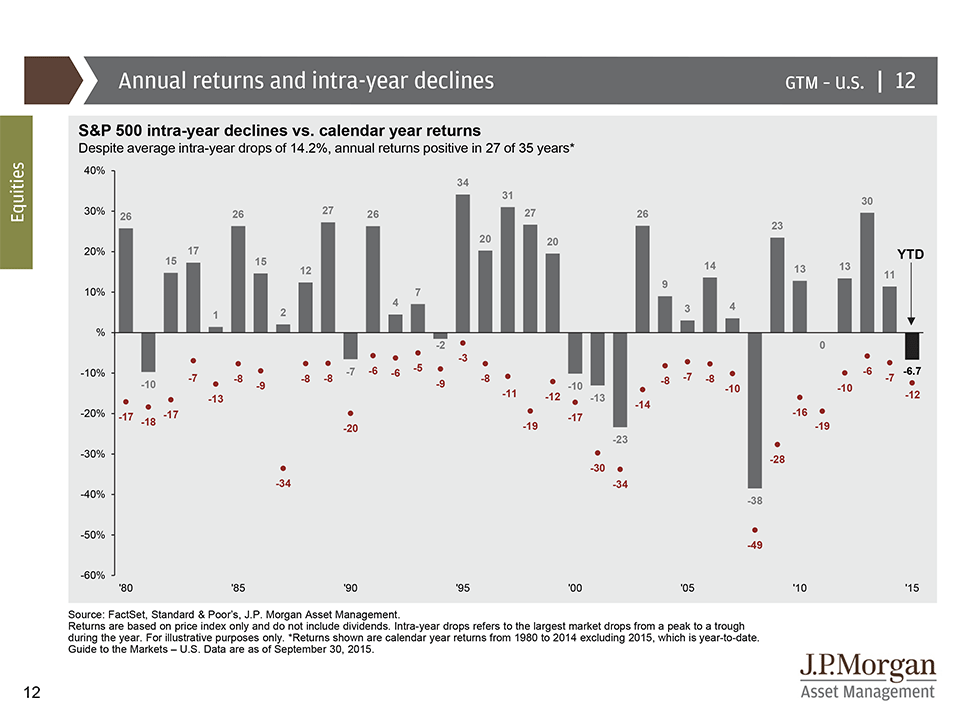
  • The market pulls back on average 14% from the market high every year giving an investor a moment to panic or simply be reminded of the risk with investing. So a double digit pull back is not only normal but common.
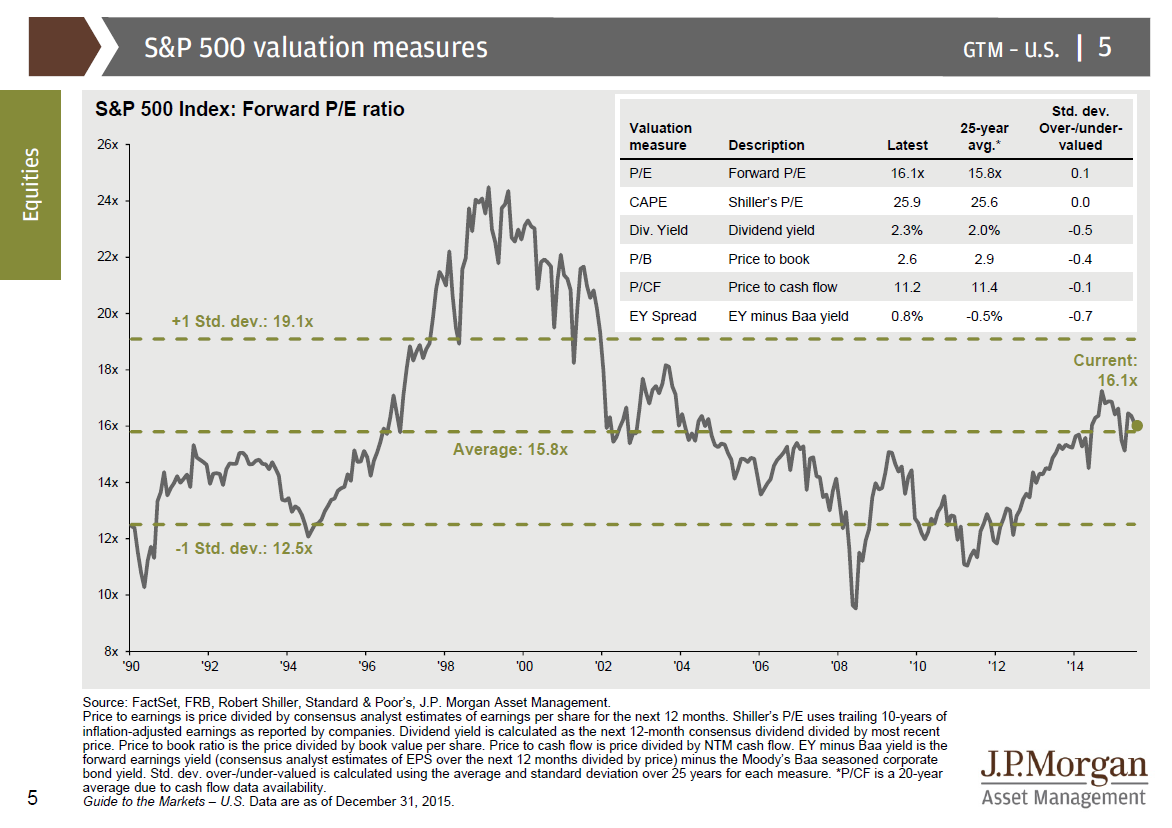
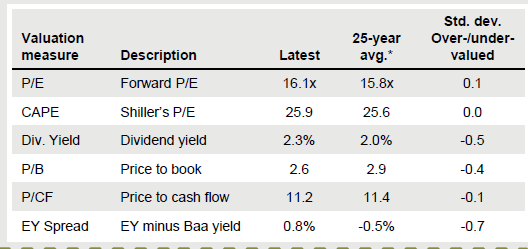
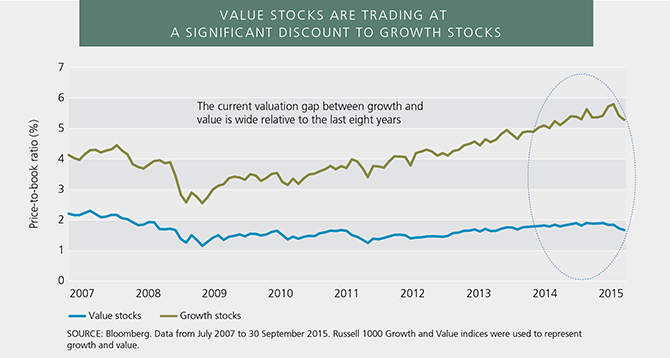
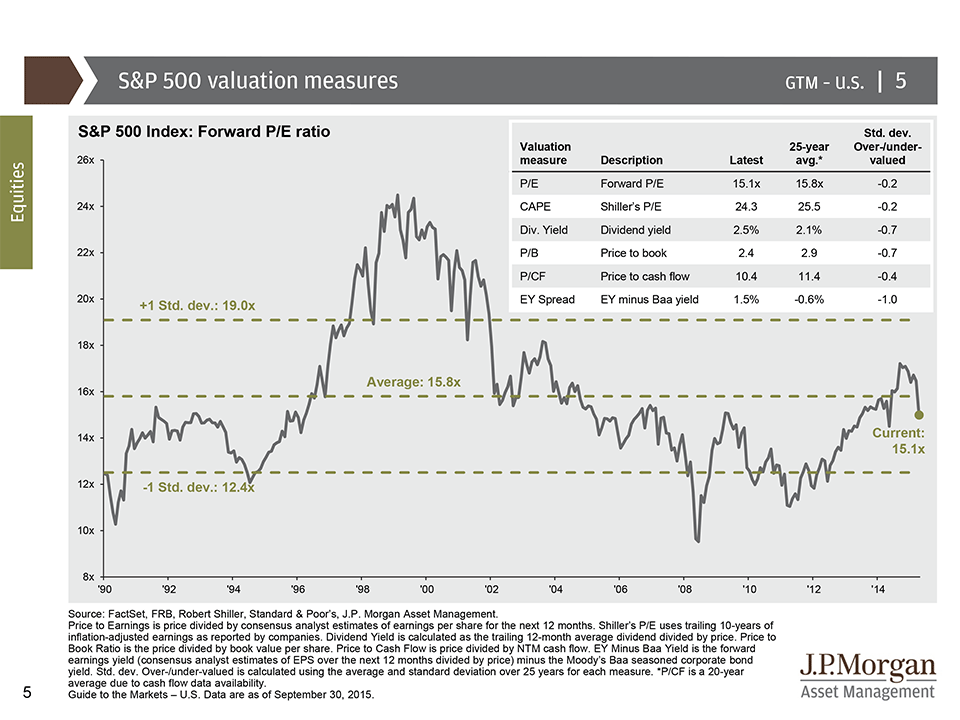
  • Pull backs can happen even when markets appear fairly valued
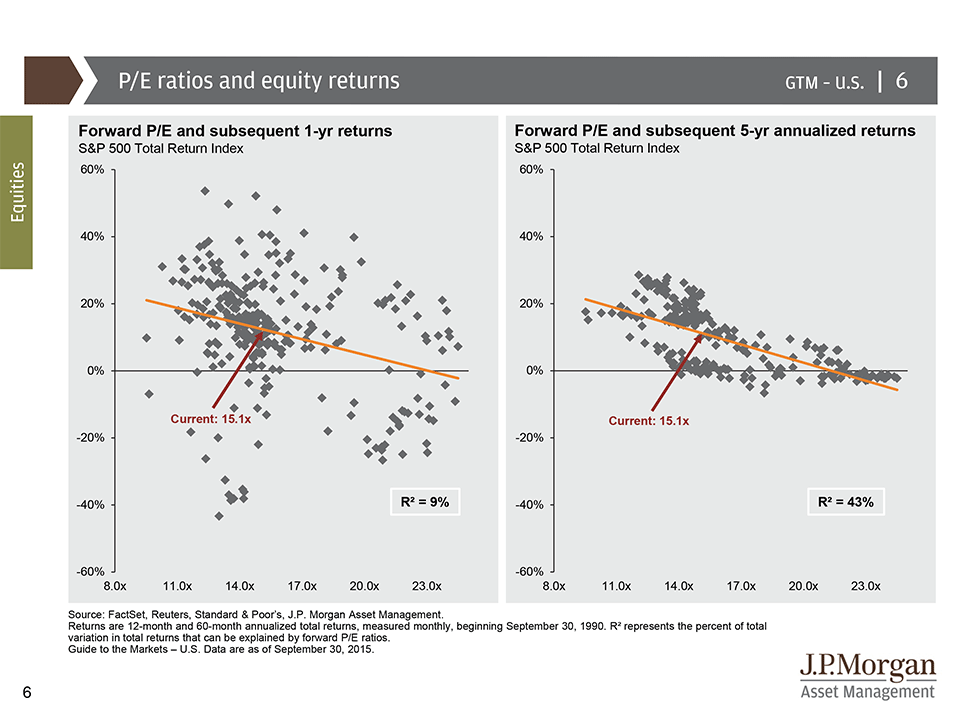
  • P/E Ratio is a poor predictor of short term performance (1 years) and only “ok” at longer periods.
  • Market Timing is difficult and rarely works

A quote from the article

And the Final Reminder – While we try to look at markets rationally, they simply are not rationale in the short term.  If investors start to panic and start selling equities and they witness this downturn, we certainly can see a much bigger drop.  However, if the fundamentals stay strong, it should prove to be another bump in the road.  Pullbacks similar to this are healthy for the market to remind investors that the stock market is risky.” August 24, 2015 blog entry


Mythical Bears and More Stock Market Reflections (Article from August 24, 2015)

This article was conceived because there are always good reasons to think bad things can happen.  Sometimes, its driven by things that make sense other times, myths.

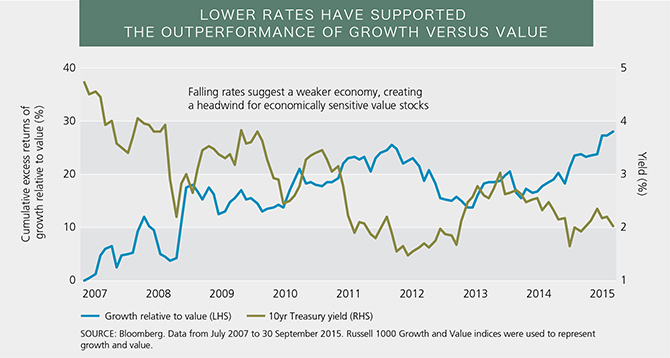
  • Myth 1 – Market is going to drop because rates are going up
    1. Despite the logical myth, when the 10 year treasury bond is less than 5%, rate hikes are associated with a higher stock market (not a drop).
    2. This makes sense in that the Fed is shifting from an accommodating policy to a restrictive policy, they are unable to do so unless the economy is on firm footing which usually means a higher 10 year bond yield.
  • Myth 2 – Companies are Fragile and poised to drop in value
    1. At this time, cash was at an all-time high and dividend payouts were increasing.
    2. Despite share buy backs and dividends increasing, cash was increasing on corporate balance sheets
  • Myth 3 – Bull Market has run for 7 years and we are due for a major correction.
    1. Fact- 1946 to 1961 had 15 years between bear markets
    2. Fact – 1987 until the Tech bubble we had 13 years.
  • Myth 4 – Markets Trend Up and Trend Down over intermediate and long time periods
    1. Over intermediate period (5-10 years) markets have generally trended up or flat vs downward trending.
    2. Marketing timing out of the market during a flat period offers minimal advantage vs staying in the market.


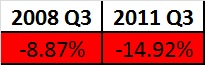
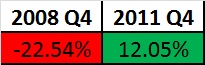
2015 Q3 Stock Market is it 2011 Q3 Again or 2008 Q3?


These articles compare similarities in 2011 and 2008’s Q3 at that point in time.    This article’s point was to argue that 2011’s Q3 , looked as bad or even worth than 2008’s and yet had a favorable outcome. So while we can draw parallel’s to 2008 we also could look at 2011.


The Take Away

We will have stock market pull backs and we will have bear markets.  It will be VERY difficult to tell the difference between the two and most times it will feel like a significant bear market is coming.   At moments like these, it is important to understand that markets have risk and the risk of a pull back is real but we will have several false alarms before the real bear shows up.  Unfortunately in most cases, we will need to participate in the bear market in order to not miss out on the long-term returns of the market.

Do I think we could have a pull back in the 10-15% range?  Yes, I think its possible.   Do I think we can see a bear market drop of greater than 20%?  It is possible but less likely than a smaller drop.   I do not see a drop like 2008 as that was a “once in a lifetime” drop, meaning it is the worst we have seen in our lifetime which means its unlikely to be that bad again (of course the possibility will always exist that we could see a worse drop).


** The information on this website is intended only for informational purposes.  Reh Wealth Advisor clients should discuss with their advisor if any action is appropriate.

Lauren Zangardi Haynes, CFP(R) Guest Article on How Entrepreneurs Can Quickly Maximize RetirementsSavings

How Entrepreneurs can quickly maximize their retirement savings

Are you a small business owner who needs to save quickly for retirement?


Many small business owners are so focused on the success of their business that they forget to protect themselves and their families by planning for retirement. In fact, if you love your work it can be hard to even imagine yourself no longer working! Yet, the hard truth of it is, one day you may not be able to work or may not want to work. And, not all small businesses are easily marketable, so relying on a large windfall from the sale of your business isn’t wise.


Different types of retirement plans work well for different types of employers. A small business owner could be best served using a SEP IRA, a SIMPLE IRA or even a 401(k) plan. Let’s focus on the SEP IRA today, as it can be an extremely powerful savings tool for the right small business owner.

What Is a SEP IRA?

A SEP IRA or Simplified Employee Pension IRA is a retirement account that can be set up by any business, regardless of size. They can be particularly favorable for a solo-entrepreneur or a business with just a few employees. SEP IRAs are funded by the employer only.


A SEP IRA is essentially a turbocharged traditional IRA. With a traditional IRA you can save just $5,500 in 2017 ($6,500 if you are 50+ and eligible for a “catch-up” contribution). Yet with a SEP IRA an employer can contribute up to 25% of your pay — up to $54,000 in 2017.


An important caveat: whatever rate you choose to contribute to your own account is the same rate you will need to contribute as a percentage of pay to all of your employee’s accounts. Also, employees can not contribute into their SEP IRA, only employer contributions are permitted.


If you are a solo-preneur this is an easy retirement savings win-win. If you have a few employees this can still make sense for you in terms of creating a competitive benefits package for your employees and building wealth for yourself on a tax-deferred basis.

Let’s run through a quick example:


Sarah runs a consulting firm and has an office manager named Tom.


Sarah will make $210,000 this year. This puts her in the 28% tax bracket because she is married and will file a joint return.


Tom earns $55,000 a year as Sarah’s office manager.


Sarah wants to save 10% of her pay. Since Sarah is in the 28% Federal Income Tax bracket this means she would need over $29,000 in income to save $21,000 after-tax ($29,000 x 28% = $8,120 taxes owed). For simplicity’s sake we won’t get into self-employment tax savings.


Instead, Sarah decides to reduce her take home pay to $189,000 and have the business make a SEP IRA contribution equal to 11% of her pay to equate to just shy of that $21,000 annual target Sarah was aiming for.


Sarah must also contributes 11% of Tom’s pay to a SEP IRA for Tom. This will equal a $6,050 contribution for Tom.


Now, Sarah saved a huge chunk of money for retirement, she looks like a hero because she just put 11% of Tom’s pay into an IRA for him AND Sarah still netted positive on taxes vs. trying to save after-tax!


Let’s frame it another way, looking solely at federal income tax at 28%, Sarah would have to pay herself over $29,000 to save $21,000 after-tax. In our example Sarah spends $27,050 in contributions to SEP IRAs for herself and Tom, and accomplished some serious savings for retirement at the same time!


WIN-WIN-WIN

Who has to be included in a SEP IRA plan?

An employee must be included in a SEP IRA plan if they have met the following requirements:


Worked for you in 3 of the last 5 years

Are over the age of 21

Earned more than $600 in compensation from your business over the year


However, you can use less restrictive requirements if you want. An important point to consider for the serial entrepreneur – if you have multiple businesses, they may constitute a controlled group. If you are a member of a controlled group, the SEP IRA will have to cover all of your employees under the SEP IRA. Check with your CPA to find out if this rule applies to you.

Great, but what if I have an off year?

Don’t worry, a SEP IRA has got you covered. With a SEP IRA you can contribute different amounts year to year. Some year’s you might contribute the maximum 25% of pay and other years you might contribute nothing. In fact, you don’t have to make a contribution until the deadline to file your business taxes. So you can wait and see how things turn out before deciding to make a SEP IRA contribution. What matters here is that you contribute at the same rate to all employee accounts.

How is a SEP IRA taxed?

Like a traditional IRA, this money is tax-deferred until you take it out at retirement. While the money is in your qualified SEP IRA you do not have to pay any taxes on capital gains, interest or dividends. This allows your money to potentially compound and grow much faster compared to a taxable account.


Also like a traditional IRA, if you withdraw money from the SEP IRA before you are 59 and ½ you will owe an additional 10% penalty tax on that withdrawal.

Pros and Cons


On the positive side SEP IRAs are:


Flexible contribution levels year-to-year

Easy to set-up

Easy to administer (most SEP IRAs do not require any annual filings)

Low cost

You can work with your existing adviser to coordinate it with your financial plan

Large annual savings limit (up to $54,000 in 2017 or 25% of your pay)


Quirks/Cons


Your contributions are capped at 25% of your net earnings from Self Employment

Loans are not available from a SEP IRA

There is no Roth option

Depending on your income, a solo-401k may allow a greater annual contribution

You have to make the same contribution amount as a percentage of pay to all employees


A SEP IRA can be a great option for a small business owner looking to save for their retirement. It’s flexible, inexpensive, and can allow you to sock away a ton of money really quickly on a tax-deferred basis. I highly recommend you speak with your financial advisor and CPA to determine if a SEP IRA makes sense for you!

About the Author

Lauren Zangardi Haynes, CFP®, CIMA® is the founder of Spark Financial Advisors a Fee-Only, NAPFA-registered financial planning firm in Richmond and Williamsburg, VA. Lauren has a blog for young professionals who are ready to create their own version of financial freedom and align their money with their values called Words on Wealth.

Guest Blog Entry -Dave Fernandez, CFP® – Fee-only vs Fee-Based

I would like to thank Dave Fernandez, CFP® for providing this excellent article on the difference between Fee-Only and Fee-Based.

What is the Difference Between “Fee-Only” and “Fee-Based?”

Coin stacks with letter dice – Fees

Do you know how your financial advisor is compensated?  Two common forms of financial advisor compensation are called ”fee-only” and “fee-based.”  They sound very similar, but they have vastly different meanings.  Whether your advisor is “Fee-Only” or “Fee-Based” can have a huge impact on the type of advice you are provided and the types of investment products which are recommended to you.

Let me provide a made up example related to the medical industry to help differentiate the two fee compensation terms.  Not everyone has worked with a financial advisor, but we all have visited a doctor.

Let’s assume you decide to visit your doctor because you have a health issue.  Upon the visit, your doctor analyzes your health problem, provides you with a recommendation, possibly sends you to a specialist for further diagnoses, or gives you a prescription to take to your local pharmacy.  In return for the doctor’s time and expertise, you likely paid him/her an out of pocket co-pay and/or your health insurance pays them a fee for your visit and any particular procedures or testing done.  This scenario would be considered fee-only.  You received a recommendation and the doctor received a fee.

Now let’s assume you visit your same doctor for the same health issue.  But we further assume that the doctor’s compensation comes from two sources: 1) a fee for an initial assessment of your health issue and 2) the doctor also receives a commission for any particular health recommendation, procedure, referral to a specialist or pharmaceutical prescription sold.  What if we take this one step further and also assume that not only does your doctor receive a commission for his/her recommendations, but that their commission based revenue can only come from a select group of products or procedures chosen by the health organization they are affiliated with?  Do you see any potential conflicts of interest in this scenario?  Would this cause you to question if you were receiving the best medical recommendation, or, if what your doctor recommended was potentially based on what paid your doctor the highest commission?  This would be considered a “fee-based” compensation arrangement.  The doctor receives a fee for the initial visit but also receives commissions for specific recommendations, procedures, referrals or prescriptions sold.

Consumers are fortunate the fee-based arrangement does not actually exist in the medical industry.  However, it is common in financial services.

The two examples above can be directly substituted into the financial advice industry.  Fee-Only means the only source of compensation your financial advisor receives is from fees paid directly to the advisor from clients. This could be in the form of an hourly fee, a retainer fee or a fee based on a percentage of the assets under investment management. Regardless of the type of fee, the point is that the client pays only a fee and no other type of compensation is charged. No commissions are received. No financial products are sold such as load mutual funds, commissioned based fixed and variable annuities, equity indexed annuities, whole life insurance or universal life insurance.  The advice and compensation is totally independent of the financial products recommended.

Fee-Based is a term the brokerage and insurance community developed to counteract the success of the Fee-Only classification. The terms certainly sound similar and consumers are confused, so their strategy seems to be working.  I can’t tell you how many times I have received a phone call from a consumer looking for a new financial advisor and one of the first things they say is that they are looking for a fee-based advisor.  I always enjoy having that conversation and explaining the terminology differences as most consumers are greatly surprised.

Where Fee-Based can be confusing and potentially misleading is that not only does an advisor receive fees, but they can also accept commissions from financial products recommended such as load based mutual funds, or annuities and insurance. This system creates the potential for a huge conflict of interest. If an advisor, like the doctor above, has the opportunity to recommend a particular financial product that pays him/her a commission versus a financial product that does not pay a commission, do you think they could be incentivized and influenced to recommend the commissioned based product?  Or, what if their product inventory only allows the choice between a select group of commissioned products based on the affiliation of their broker dealer?  Would this raise a question – are the financial products offered to me what is best for my financial situation, and, do they make use of the best potential options considering the whole universe of financial products available?

No compensation system is perfect and free from all conflicts of interest.  And certainly there are some great fee-based advisors doing amazing work for their clients.  But we strongly believe the fee-only compensation method most closely aligns the interest of consumers with their financial advisor.  We are proud and fortunate to belong to a great organization called www.NAPFA.org (National Association of Personal Financial Advisors), which represents a like-minded group of fee-only, fiduciary based financial advisors throughout the United States.

So when deciding which advisor you would like to hire, we suggest that you ask how the advisor is compensated, request that they disclose their compensation in writing and look for someone who is paid as a “Fee-Only” advisor to eliminate as many conflicts of interest as possible.

Or, if you decide to work with a fee-based, commissioned advisor, at least look for one that is licensed under a fiduciary regulation.  The fiduciary law requires that all compensation is disclosed in writing.  Thus if you are going to pay commissions for advice and financial products, you will at least know what you are paying for.

About The Author

Dave Fernandez, CFP® is a native of Arizona and has over 20 years of experience in the financial services industry.  He started his financial services career in 1995.  As a NAPFA Registered Financial Advisor, Dave owns a fee only financial planning and wealth management firm, in Scottsdale, Arizona called “Wealth Engineering, LLC.”

Guest Blog Article Greg Phelps, CFP® How “Safe” Are Your Bond Investments?

How “Safe” Are Your Bond Investments? – A Guest Article from Greg Phelps, CFP®

I want to thank Greg Phelps for his highly timely article on bonds, especially given the recent rise in rates.  Thanks again Greg for your valuable contribution.  If you are in the Las Vegas area looking for an advisor, be sure to look him up. – Thanks Steve Reh

Most investors think of bonds as “safe”. The fact is bonds can be risky as well, not as risky as stocks generally speaking, but risky nonetheless.

Bonds guarantee a return of principle with interest payments. But if their return is guaranteed, why are bonds risky?

Let’s define risk for a moment. Is risk the “loss” of principal, or the “volatility” of your principal? If you define risk as volatility – which could lead to losses if you sell in a bad period – then bonds are risky because values are volatile.


Why Are Bonds Volatile?

Bond values fluctuate with interest rates in the economy. When interest rates rise, bond values fall. When interest rates fall, bond values rise.


This is an important concept, so we’ll walk through a few simple examples.


What If Interest Rates Go Up?

Key and a Stock Certificate. Key To Investing ConceptIf your neighbor bought a 10 year bond paying 3% a year ago, and similar 9 year bonds are paying 4% today – you wouldn’t want to buy his 3% bond. You’d buy a new bond with the higher interest rate.

Purchase Date Bond Investment Coupon Rate Yearly Income Term in years
1/1/2015 $1,000 3% $30 10
1/1/2016 $1,000 4% $40 9


Interest rates rose over that one year period, so your neighbor’s bond value must drop. His bond pays $10 less per year than a new bond after all.

Your neighbors bond value will drop in an amount which compensates a potential buyer for the reduced income (compared to what he could get today). The calculations are complex, and in the real marketplace it’s all based on supply and demand.

Some investors prefer the coupon payment. Others prefer the capital increase in value over time, and don’t necessarily need the larger interest payment. These factors affect the value on the open market.

This drop in value (also called a discount) will bring the total yield up to 4% over the life of the bond, so it matches current 9 year bond rates. The interest payment stays the same at 3%, but the capital gain between the discount paid and the bond’s maturity value compensates the new investor with a total yield roughly equal to 4%.


What If Bond Rates Drop?

Conversely, if you bought a 10 year bond a year ago yielding 5%, and rates today are 3% for similar bonds you’d be able to sell your bond for a premium. A premium means you’ll get more than for your bond than its maturity value. Your bond pays more interest to an investor than they’d otherwise get with current bonds, so you deserve a higher price.


Purchase Date Bond Investment Coupon Rate Yearly Income Term in years
1/1/2015 $1,000 5% $50 10
1/1/2016 $1,000 3% $30 9


These are overly simplistic examples, but they illustrate a concept. When interest rates rise, bond values drop. When interest rates drop, bond values rise.


So Just How Much Do Bonds Fluctuate?

It really depends on supply and demand in the marketplace. This is determined by perceived current and future risk, and most of this risk is in the form of time.

Some bonds mature in the short term, such as a year or two. Some mature in the intermediate term, for example 5 years or so. Some are long bonds and mature in 20 or 30 year.  The longer the bond’s maturity, the more they drop in value when rates rise, and the more they rise in value when rates drop. This volatility is measured by “standard deviation”.


Bond Returns And Risk[1]

One-Month
US Treasury
Bills
BofA ML Six-Month
US Treasury Bill Index
BofA ML One-Year
US Treasury Note Index
Five-Year
US Treasury Notes
Long-Term Gov. Bonds
Return 5.19% 5.91% 6.08% 7.52% 8.31%
Risk 1.66% 2.01% 2.55% 6.34% 12.14%


The longer your bond portfolio’s maturity, the more risk you have in holding those bonds. There’s a point at about 5 years when the risk really starts to spike.

The question becomes “at what point is the volatility with your bond portfolio too high?” In other words, if you’re investing in longer term bonds for the yield, you’re likely taking a lot of volatility risk. There comes a point when the risk of long term bonds can rival some stock investments.


Bonds For Stability

Most investors buy bonds for yield when in fact they should be buying bonds to provide portfolio stability, like ballast in a boat. Ballast provides ship stability when the weather gets rough… and trust me the markets will get rough!

The total return from a portfolio is far more important than the returns generated from any individual investment in the portfolio. Even though shorter maturity bonds pay less interest, the easiest way to reduce portfolio volatility (assuming you’ve reduced your exposure to stocks first) is to reduce bond maturity.


About The Author

Greg Phelps, CFP®, CLU®, AIF®, AAMS® is the President of Redrock Wealth Management, a fee only fiduciary advisor in Las Vegas. Greg has been a financial planner for over 20 years, and specializes in retirement wealth management for baby boomers. He’s also the founder at RetireWire.coma retirement financial and money management blog.

[1] Data calculated (or derived) based on data from the CRSP US Stock Database ©2014 Center for Research in Security Prices (CRSP®)

Guest Article by Gregory A. Johnston, CFA®, CFP® – Factor Investing

Gregory A. Johnston, CFA®, CFP® shares with investwithsteve.com about factor investing.

Factor Investing –  I would like to thank Gregory A. Johnston, CFA®, CFP® for sharing his thoughts on Factor Investing.  At Reh Wealth Advisors LLC, we use some of the principles of factor investing and have used value and small tilts to our portfolio. If you are in the Illinois area and looking for great Fee-Only Planner be sure to look up Gregory and Johnston Investment Counsel.  Thanks for the great article Gregory, 

Regards,
Steve

Factor Investing


One of the newest things (I will refrain from using the word fad) in the investment world is the proliferation of factor investing.  It seems that every exchange-traded fund (ETF) firm has created a suite of ETF’s that seek to emphasize factor investing.


What Are Investment Factors?

An investing factor is simply a characteristic.  It could be a fundamental or technical characteristic.  A fundamental factor will use data from a company’s income and/or balance sheet while a technical factor would likely use some form of historical price change.  There literally are hundreds if not thousands of potential factors.  Examples of possible fundamental factors could be price / sales, and price / earnings.  Technical factors could be price change over the past 13 weeks as well as a calculation of momentum.


Why Do I Care About Investment Factors?

During the past few decades, academic researchers have identified certain factors that historically have outperformed other factors.  The factors identified as having outperformance characteristics include:  value, low size, quality, momentum, low volatility, and high yield.  So, over time, if an investor held a portfolio of these “factor tilts” they may have outperformed an index.


It is imperative to understand that the previously mentioned factors have been identified as historically providing excess risk-adjusted returns.  That does not mean these excess returns will be repeated into the future nor does it mean these factors outperform each and every year.  In fact, many of these factors will have several years where the factor may be out of favor.  So an investor will need patience to earn the possible factor outperformance.


How Are the Funds Created?

As previously mentioned, there has been a widespread increase in the number of factor-investing ETF’s.  Many firms will create a single factor ETF (think just value or momentum) while others will create a multi-factor ETF that seeks to combine multiple factors into a single portfolio.


Regardless of whether the ETF is a single or multi-factor fund, how the factors are defined and the portfolio is constructed is of critical importance.  There are several things investors should evaluate:


  • What characteristic(s) are used in creating the specific factor? For example, assuming a value-factor fund, is a single company characteristic used or are there other value characteristics that are averaged or perhaps weighted in some way?
  • Are there company size parameters in creating the universe of potential holdings?
  • How does the manager determine the number of holdings?
  • How does the manager deal with potential sector concentration (or lack of sector allocation)?
  • How often is the portfolio re-scored and rebalanced?


Additional Considerations

Most of the factors mentioned have been extensively researched and have historically provided excess returns.  However, investors should be aware that:

  • While historically providing a return benefit, that has no predictive power for the future
  • Now that there are many factor-based funds, using similar factor characteristics, will the “factor benefit” simply be arbitraged away because of the higher demand for that factor?
  • A factor does not necessarily outperform each day, month, or year. So an investor will need to have a degree of patience during those periods of underperformance.


With those caveats, investors might be able to identify specific factors that are in-/out- of favor at specific points in time and over-/under- weight a specific factor.


While the significant increase in the number of funds gives us a significant amount of pause, we believe these factor investing funds do bear watching and, when thoroughly evaluated (including underlying expense ratios), may be a reasonable addition to a portfolio.


On our website, there are links to a variety of investment-related information and articles.


About the Author

Gregory A. Johnston, CFA®, CFP®, CPWA®, QPFC, AIF® has over 25 years of investment and comprehensive finanical planning experience.  He started Johnston Investment Counsel in 1997 as an independent,  fee-only investment management and comprehensive planning firm located in Peoria, Illinois.  His clients include individuals, retirement plans, and endowments / foundations.

Guest Post by Michael J. Garry, CFP®, JD/MBA – WHAT DO STARTUPS AND BABY BOOMERS HAVE IN COMMON?

Michael J. Garry, CFP®, JD/MBA

WHAT DO STARTUPS AND BABY BOOMERS HAVE IN COMMON?


“I want to thank Michael Garry, CFP®, JD/MBA the owner of a fee-only financial planning and wealth management firm, Yardley Wealth Management, LLC for sharing his expertise in this great analogy comparing baby boomers and start ups.”

Michael J. Garry, CFP®, JD/MBA

One might read an article in Fast Company or the Economist about some of the classic financial mistakes that plague startups and think, “How could they have been so naïve?” Don’t be so quick to judge. When it comes to planning for retirement, Baby Boomers seem to be wrought by the same naiveté.


It is vital to be aware of these five common “mistakes” as you prepare to enter retirement.

Not Understanding Your Market


As a business owner, market research provides a big-picture view of your real business prospect. Likewise, in retirement, understanding the new world into which you are embarking will result in peace of mind later.


When planning your retirement, it is important to know whether your goals and aspirations are aligned with your physical, emotional and financial means.

Not Having Enough Startup Capital


People assume that their Social Security, investments, and pension will be enough to to allow them to live the way they’d like to through retirement. Many people underestimate their cost of living and have an unrealistic expectation of how their existing portfolio will perform.


Having a portfolio that is appropriately aligned with your risk tolerance, needs, and goals is paramount to having a secure nest egg. Without the proper plan in place one might find themselves with less cash flow than they bargained for.

Failing to Record Cash Flow


Understanding where your money comes from is very important. Social Security, Medicare, and retirement savings withdrawals have deadlines associated with them that, if ignored, can cost a person thousands. The more organized you are the more control you will have over your financial future.

Under-calculating the Hidden Costs of Operation


It is crucial to project and consider not only operational costs but also hidden and associated costs. The same can be said for the cost of living in retirement. Accounting for increased medical expenses, inflation, the need for a new vehicle every few years and maintenance on your home are just a few of the items that we see people forgetting to include in their annual budgets. Poor planning could leave you in a position where you feel bound by a tighter budget.

Overspending


When people retire they can be so elated by the freedom they suddenly possess, that they may lose focus on their future and their budget which can lead to a stark reality in short order.


Drawing down from your investments to make big purchases that are out of your budget, with the idea that you will make up for it by being more frugal later on could lead to disaster. What if the financial markets experience a downturn? You still need to make withdrawals for living expenses, but now your portfolio may not have as much cushion to ride out the temporary decline and bounce back as quickly as it would have, had you not unwisely splurged the prior year.


From Steve: “Thanks again Michael.  If you are in the Doylestown, PA, New Hope, PA, Newtown, PA, Yardley, PA, Pennington, NJ, and Princeton, NJ area and need help with overcoming some of these issues, do not hesitate giving Michael a call.”


Michael Garry, CFP®, JD/MBA is a NAPFA-Registered Financial Advisor, the owner of a fee-only financial planning and wealth management firm, Yardley Wealth Management, LLC located in Newtown, PA and the author of Independent Financial Planning: Your Ultimate Guide to Finding and Choosing the Right Financial Planner.

Guest Post by Greg Phelps CFP®- Asset Allocation Made Simple!

Asset Allocation Guest Post with Greg Phelps CFP

Asset Allocation Made Simple! A Guest Post by Greg Phelps CFP®

Asset Allocation With Greg Phelps CFP®

I want to thank Greg Phelps CFP®, President of Red Rock Wealth in Las Vegas, for joining us and providing his expertise on Asset Allocation.  The analogy for asset allocation I like use is baking a cake.  The asset allocation is recipe for baking  your cake, the stocks/bonds/mutual funds/ETFs are your ingredients, the cake is your portfolio.  I really like the way Greg explained the importance asset allocation and I hope you will too!

We talk about it all the time, you may even hear it on the news if you’re watching financial channels – but what exactly is asset allocation? Simply put, asset allocation is the process of dividing up your investments into groups of similar securities then allocating distinctly separate amounts of your investment capital in them.


Why would we do this? Because groups of similar securities grow and fluctuate similarly to each other, but relatively different to other groups of securities. By matching these groups together in different percentages you can reduce your overall portfolio risk and volatility. When stocks go up for example bonds may drop or stay flat, and vice versa.


It’s very important to note that the allocation plan must revolve around not only your risk tolerance, but your financial plan. We invest in stocks according to a solid retirement plan (as does Stephen Reh). After working with investors for over 20 years it still baffles me how most investors act like Nike and “just invest” without taking the time to match their investment plan with their financial goals and objectives.


Most experts believe that the importance of the individual investments and securities within your portfolio is a distant second to the percentages into which they are allocated. Study after study has shown that it’s not what stocks, bonds, or mutual funds you invest in, it’s the percentage allocation of assets such as stocks, bonds, cash and commodities that determines over 90% of your investment results!

Asset Allocation Guest Post with Greg Phelps CFP®

So just what are asset classes?


There are three main assets classes utilized in generating an asset allocation model for your investment portfolio.  All assets within each class exhibit similar characteristics. They are:


  • Equities (Stocks)
  • Fixed Income (Bonds)
  • Cash Equivalents (Money Market Instruments)


Some financial advisors and investors would add commodities to the list of primary asset classes. We believe indeed it is a primary asset class because it has illustrated very little correlation to the other asset classes. By correlation, we mean it fluctuates up and down in value highly independently from the other asset classes. For example, last year commodities plunged 20%+ while US large stocks were about flat.


That difference in movement is what we refer to as “non-correlation”. It’s the degree (or lack thereof) in which one asset class moves relative to another. The three or four main asset classes have very low or even negative correlation to each other. By allocating different amounts to them you can reduce your investment account fluctuations overall.


But what about different types of stocks or bonds?


The three or four primary asset classes can further be broken down into smaller groups of similar securities. We’ll call those “sub asset classes” for simplicity. The degree of correlation rises as each group is broken down further and further because the similarities between them rises.


Some sub asset classes include but are not limited to:


  • Large Value Stocks
  • Large Growth Stocks
  • Small Value Stocks
  • Small Growth Stocks
  • International Developed Stocks
  • Emerging Market Stocks
  • Real Estate or REIT’s
  • Commodities
  • Short Term Bonds
  • Intermediate Term Bonds
  • Inflation Protected Bonds
  • High Yield Bonds
  • International Bonds


The benefits of asset allocation


A primary goal for any investment plan is to mitigate investment risks, while maximizing potential investment returns. This can be done most effectively with proper asset allocation and broad portfolio diversification.


If you have any concerns whatsoever about investing in the stock market, bond market, or even cash and commodities you should give Stephen Reh a call and make sure your asset allocation is in line with your financial plan. Market bumps shouldn’t concern you if you’re plan is solid, and it will be if you take the time to work with Stephen.


Greg Phelps, CFP®, CLU®, AIF®, AAMS® is the president of Redrock Wealth Management, a fiduciary financial advisor in Las Vegas. Redrock is a member of the National Association of Personal Financial Advisors like Stephen Reh, and specializes on retirement transition and decumulation planning.


Greg, thanks again for accepting the invitation to contibute to www.investwithsteve.com.  You expertise is appreciated.  If you are in the Las Vegas area and looking for a fee only financial advisor, I recommend giving Greg a call.

2015 Q4 Update – 2015 Q3 Stock Market is it 2011 Again or 2008 — Spoiler it was 2011

2015 Q4 Update Stock Market Rebounds

Update to the Article: 2015 Q3 Stock Market, Is it 2011 Q3 Again or 2008 Q3?

I realize that people are likely more interested in my opinion on the current market drop but I first want to revist our last market drop.  I will have another article about our current market conditions soon.

Here is a link to our previous article below:

2015 Q3 Stock Market is it 2011 Again or 2008

What Happened in Previous Market drops of Q3 2011 and Q3 2008?

As a reminder here is the performance for the S&p500 in Q2 2008 and Q3 2011.  An ugly 8.87% and an uglier 14.92% loss in 2011.

Q3 Comparison


What Happened in Q4 2011 and Q4 2008?

And here is a reminder how Q4 went in both time periods.

Q4 Comparison


Update – Let’s Look at 2015 Q4

2015 Q4 Update Stock Market Rebounds


Thankfully, the 4th quarter of 2015 looked a lot more like the 4th quarter of 2011.


As mentioned previously,  2008 tended to be an anomaly in that it was one of the worst years we have experienced in the stock market; certainly it was the worst of my lifetime.  Our bias is to remember things we experience and give a greater likelihood of thinking it will occur again (the phenomena is called the “Availability Bias”).  The Availability Bias is the bias that is how we estimate future probabilities based on how easy it is to remember.  A good example would be our current drought in Southern California.  Most Southern Californians would likely overestimate the probability of future droughts based on the ease they can remember our current drought.

Where are we at a valuation Standpoint as of 12/31/2015?

The equity market does not appear to be valued too high or too low.  According to the most recent data as of 12/31/2015 in the JP Morgan “Guide to the Markets”, most measure show that the market is fairly valued.

JPMorgan_market_Valuation_12-31-15


JPMorgan_market_Valuation_measures_12-31-15

(Source: JP Morgan)

The P/E (Price to earning measure), CAPE (cyclically adjusted Price to earnings), and P/CF (Price to Cash Flow) all show a market that is fairly valued.

Dividend yield, Price to Book value, and Earning Yield less Baa Bond yield all show that the market is slightly undervalued currently.

So how do I feel about it currently?  As I stated last quarter, I actually think the market is fairly valued and there is both upside and downside and I feel that our best course of action is a diversified portfolio.  If valuation measure were dramatically different, I might feel otherwise.

What about the Bond market with the recent Fed Rate Increase?  I am worried about the bond market but I think for investors in diversified portfolios, the fear is over blown.  The Fed raised rates slightly but it the impact on bond prices was relatively tame.  I think the Fed will be cautious about raising rates unless inflation kicks up.

What is our takeaway?

When markets misbehave (go down), we should look at times in history to see what happened.  We should look at valuation ratios to see if the market is reasonably valued.  In many cases, the best course of action is to 1) take tax losses if you can 2) rebalance if you are too far from your model 3) Trust your asset allocation and risk to prevent you from performance chasing.

** The information on this website is intended only for informational purposes. Investors should not act upon any of the information here without performing their own due diligence. Reh Wealth Advisor clients should discuss with their advisor if any action is appropriate.


Value Premium Dead or Poised for a Comeback in 2016 Investments?

Value Premium Dead or Poised for a Comeback in 2016 Investments?

It has been thoroughly documented in research (Fama and French) that there is a value premium where in the long run value stocks have better risk adjusted performance than growth stocks.

For the 10 years ending in October 31, 2015, the Russell 1000 Growth Index outperformed the Russell 1000 Value index by 2.35% annualized.  That is a significant difference, especially since history and research has told us that we should expect value to outperform most decades. (source: Pimco)

What has made this past decade favor Growth?

Pimco argues there are two reasons and those reason are grounded in low rates. (Chart Source: Pimco)

Value Premium - Lower Rates Have Promoted Growth over Value
Lower Rates Have Promoted Growth over Value

Reason #1 – Low rates are a reflection of fear about economic growth following the financial crisis

After the financial crisis, future expectations for the economy were weak. Further, we have seen muted growth in the economy the past 10 years, especially compared to the growth in the stock market from 2009-2015.

Value stocks tend to be stocks whose value is tied to their current earnings and thus their returns tend to be more cyclical and tied to the growth and performance of the global economy.  Growth stocks are less dependent and grounded by expectations of the overall economy.  The price of a growth stock is more dependent on earnings much further into the future than value stocks that are priced more by their current or shorter term earnings.

For example, no one expects Coca Cola to sell many more cans of Coke in the next 5 years than they did the past 5 years because their distribution and product is very mature.  Conversely, many would expect Netflix to grow quickly as more people become interested in consuming media via streaming video.

Reason #2 – Lower Interest Rates lead to lower discount rates which favors growth stocks.

Pimco also argues that stocks value is the discounted future cash flow (earnings) of the company.  As the amount we discount the earnings drops, the value of the future cash flows increase.  Since growth stocks have a higher percentage of the earnings occurring in the future vs Value stocks, the prices of growth stocks have gone up more than value stocks.


Recent Outperformance has led to a relative valuation gap compared to previous years

Value Premium - Value Trading at a Discount to Growth

With Growth outperforming value, it appears on a price to book ratio, the gap in value between growth and value stocks going forward appears to favor value according to Pimco.


Pimco further argues that a relatively few large growth companies have propelled growth stocks higher and the performance of a few stocks (called a narrow market) tends to be unsustainable over time.  Therefore they see a strengthening economy, rising, rates, a valuation discount, and a narrow market led by few large growth stocks all pointing towards the potential return for the value premium.

(Chart Source: Pimco)

My Question – Are things truly different this time or are we merely seeing a moment in time that value underperforms.


Generally speaking, there is regression to the mean (tendency for trends to reverse) in outperformance.  The question facing us today is that it has been academically shown that value stocks have better historical risk adjusted returns vs growth stocks and our question is “will value prove to be better going forward?  Or are we facing a new situation when the value premium is gone forever?”

I tend to fall into the camp that most times in the financial world someone tries to tell me that this time is different, its more likely to be the same.  In my  opinion, Growth has had its time in the sun and at some point value will outperform.

Due to the academically proven risk adjusted returns of value stocks we have overweighted value in our portfolios and recent history has hurt our returns.  However, going forward, I feel the value “tilt” will help drive the performance of our portolio.  As always, past results do not guarantee future returns.

Much of the analysis in this report was from this great article on Pimco:

http://blog.pimco.com/2015/11/24/equities-are-conditions-right-for-value-versus-growth/

** The information on this website is intended only for informational purposes. Investors should not act upon any of the information here without performing their own due diligence. Reh Wealth Advisor clients should discuss with their advisor if any action is appropriate.

Update to our Stock Market Reflection Article – Data as of 9/30/15

I wanted to write an article with an update to some of the data since we last looked at it in the following article:

https://investwithsteve.com/2015/08/stock-market-pull-back-time-to-reflect/

Annual Returns and Intra-Year Declines

As we previously discussed, at that time through July 31, 2015 the market had only declined 4% from its market high.  Due to a rough August and September, we can see the S&P500 declined 12% from its high:

Stock Market Intra year declines
That 12% drop is almost at the average intra year drop of 14.2%.  As a reminder, we can see that despite several years were there were relatively large drop, many years still ended up being positive.  That scenarios increases the risk that an investor might sell at the wrong time or may incorrectly time the market.

Current Valuation – the Market is still fairly valued

By looking at the major valuation metrics (P/E, CAPE, Div Yield, P/B, P/CF, and EY Spread), the market is slightly undervalued.  Since its less than one standard deviation (far right column), I would actually classify this market as “fairly valued”.  We are not seeing panic or greed driven values currently.

SP500 Valuation Measures


P/E Ratio is Poor Predictor of Short Term Performance but much better at Intermediate Performance

Although the model predicts good returns over the next year, the R Squared is only 9% so using P/E to predict the next 12 months is a dangerous proposition.  It does show that according to P/E, we are not seeing a dramatically overvalued market.  As we have discussed before, the 5 year performance based on P/E is much stronger with an R Squared of 43%.  That means the current P/E can explain 43% of the next 5 years performance.   The current P/E indicated the next 5 year should be good for the market.


PE and Returns


I would like to thank JP Morgan for their always excellent quarterly guide to the markets where the slides came from.

https://www.jpmorganfunds.com/cm/Satellite?UserFriendlyURL=diguidetomarkets&pagename=jpmfVanityWrapper

** The information on this website is intended only for informational purposes. As always, past results do not guarantee future returns.  Reh Wealth Advisor clients should discuss with their advisor if any action is appropriate.