

Stock Market Pull Back, Time to Put Pull Backs in Perspective
With the recent pull back, I wanted to put a few items in perspective:
1) Historical intra-year declines (pull backs)
2) Current Valuation and statistical analysis
3) P/E as a predictor of stock market performance in the short term and long term.
4) Are retail investor still trying to time the market? Does it Work?
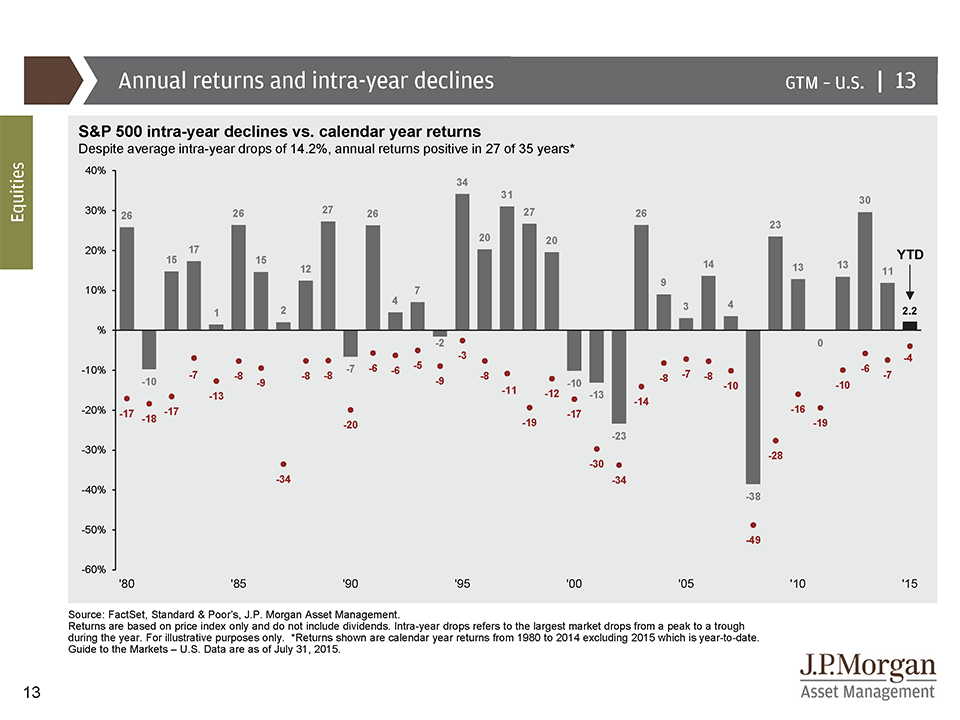
Annual Returns and Intra-Year Declines
The past week has been rough for the market. The below picture shows how rough a typical year is. The average peak decline in a calendar year is about 14%. So while we have hit a rough patch this week, its relatively normal for most calendar years.
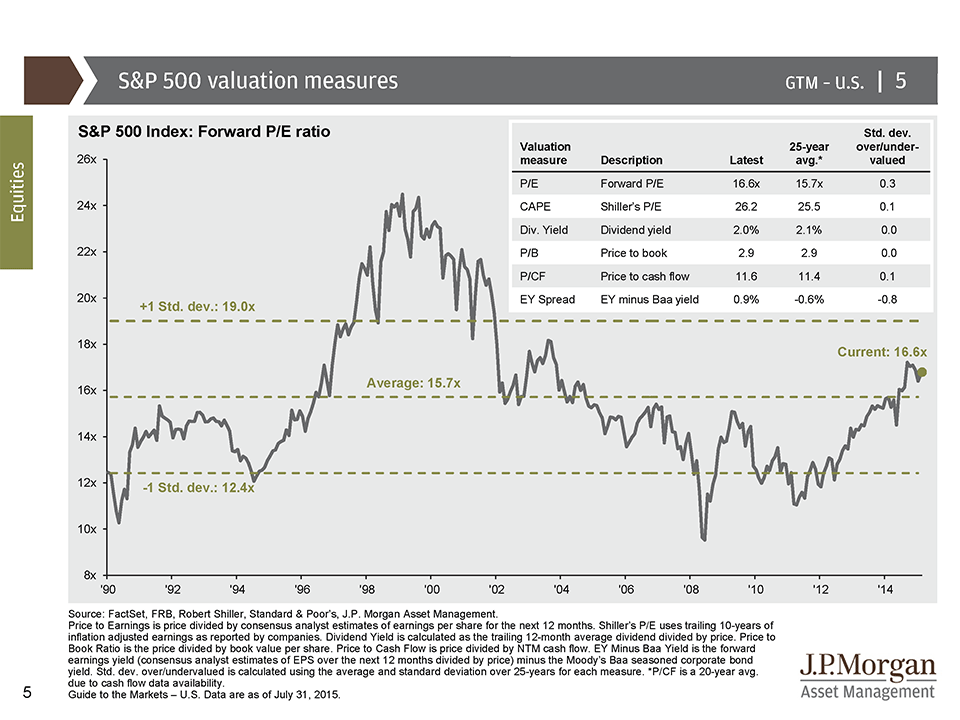
Current Market Valuation Measures – Hint – Market is Fairly Valued
The second slide attached shows the “standard deviation” of current vs historical valuation measures. While they are all slightly higher (meaning the market might be slightly overvalued), the standard deviation of almost 0 indicates that the market is fairly valued and almost completely normal relative to the historical average. The media seems to keep saying the market is over-valued lately but the statistics say otherwise.
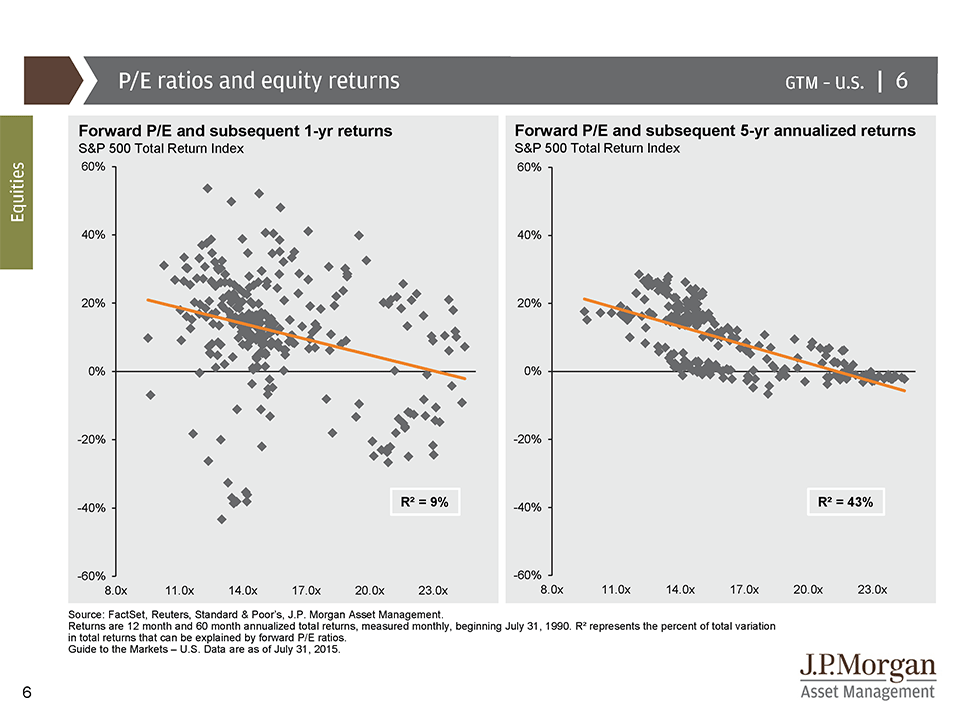
P/E Ratio is Poor Predictor of Short Term Performance but much better at Intermediate Performance
The third slide, shows that if we look at the P/E ratio (price to earning), it is a terrible measure at predicting the next 12 months of performance for the stock market. In statistics, the R Squared measure explains how much of the next 12 months is explained by the P/E ratio. It comes in at a miserable 9% meaning that its useless for predicting short term performance. Interestingly, the P/E ratio is a better measure for longer period performance. The P/E ratio over 5 year periods helps explain 43% of performance of the subsequent years performance. Further, at the current P/E ratio, we would expect the market to be positive and not much different than historical returns for the market. (Current P/E is about 16.6).
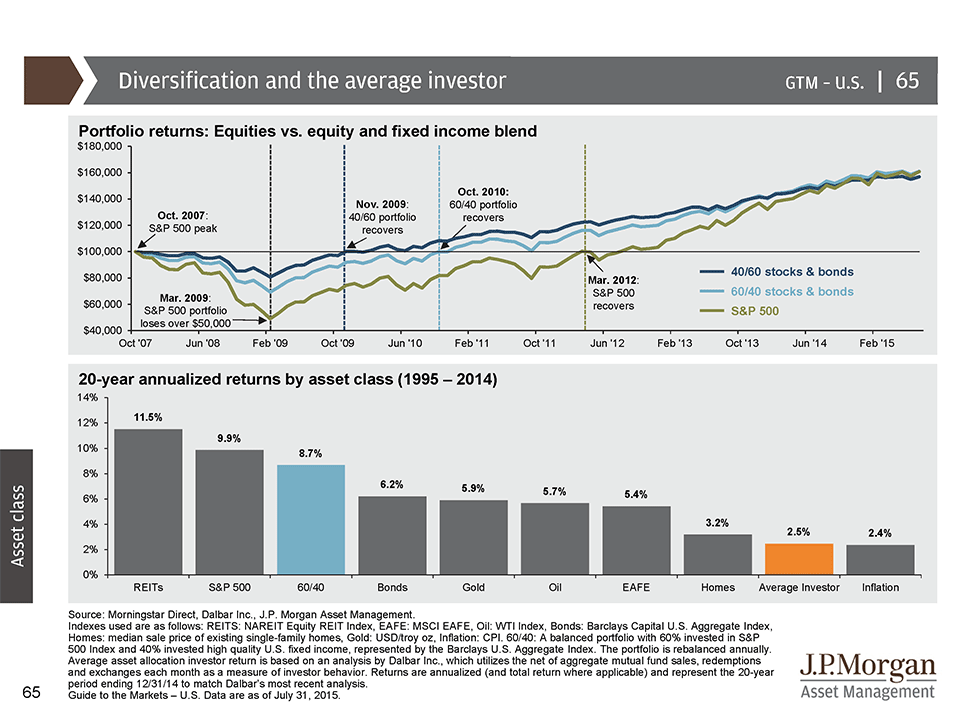
Market Timing and Why the Average Investor Loses
These pull backs often cause fear and investor might sell after a drop. Is this a real danger?
The simple answer is yes. In my opinion, the next slide shows that the average investor sells stocks when they get scared and buys stocks when they are comfortable. It helps explain how the average investor has managed to under perform nearly every asset class returning 2.5% and barely beating inflation which returned 2.4%. If there is any chart that shows the danger of market timing, its the one below.
I know your next question. You are going to ask me if investors recently have learned their lessons better? Well, on to the next chart:
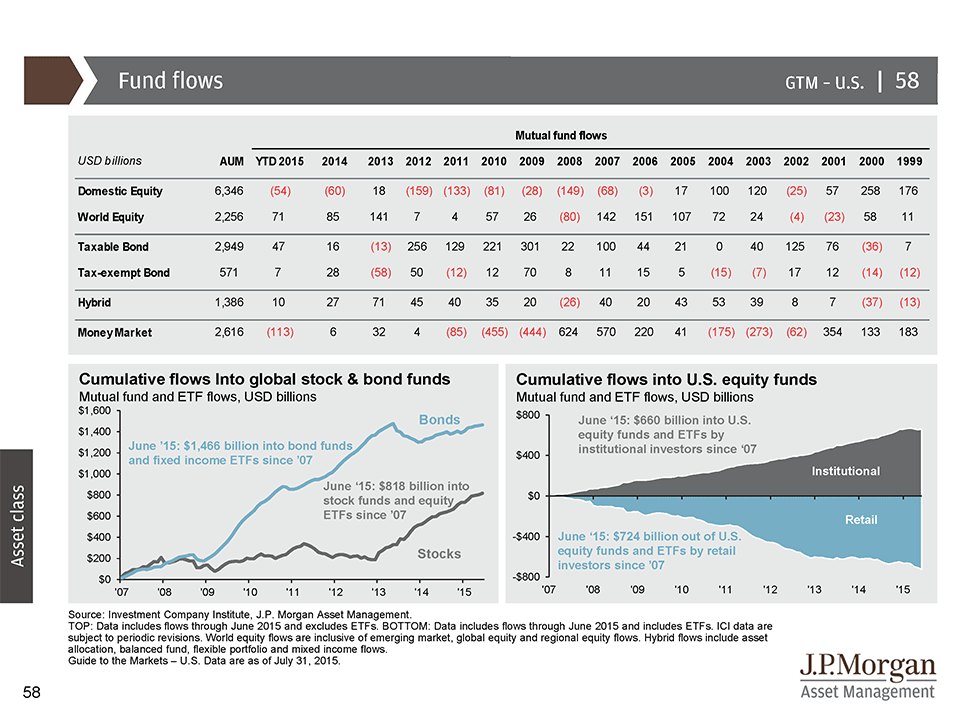
Yikes! From 2009 until 2012, the retail investor has been selling their equities missing out on much of the recent run up in the market. In 2013, nearly 5 years after the financial crisis of 2008, the retail investor finally returned to the stock market. Further, the retail investor has been selling their stocks and buying bonds. Looking at institutional investors (pensions funds, endowments, etc), we see that they mostly have been adding funds to US equities as the retail investor has been selling.
So despite the relatively common knowledge that timing the stock market is difficult, retail investors continue to be late to party on bull markets, and will likely sell their stocks after the market drops, again showing that timing the market can be hazardous to your retirement goals.
Tolerating volatility is difficult and why it is critical to build a portfolio that will allow you to ride out challenging periods in the stock market.
The Take Away or Lesson from this Post?
What is our takeaway from this? Market declines in a year are very common even in years that end up with good positive performance. Market Valuation measures are not screaming that the market is over or under valued but rather that its a pretty boring fairly valued. Lastly, valuation measures are poor guides for short term performance, so we should be careful about making knee jerk reactions to numbers and stories we hear in the media.
And the Final Reminder – While we try to look at markets rationally, they simply are not rationale in the short term. If investors start to panic and start selling equities and they witness this downturn, we certainly can see a much bigger drop. However, if the fundamentals stay strong, it should prove to be another bump in the road. Pullbacks similar to this are healthy for the market to remind investors that the stock market is risky.
I would like to thank JP Morgan for their always excellent quarterly guide to the markets where the slides came from.
** The information on this website is intended only for informational purposes. Reh Wealth Advisor clients should discuss with their advisor if any action is appropriate.