THE SBA HAS RELEASED THE FOLLOWING UPDATES (PLEASE NOTE ALL THAT FOLLOWS IS FROM THE SBA).
On March 29, 2020, following the passage of the CARES Act, the SBA provided small business owners and non-profits impacted by COVID-19 with the opportunity to obtain up to a $10,000 Advance on their Economic Injury Disaster Loan (EIDL). The Advance is available as part of the full EIDL application and will be transferred into the account you provide shortly after your application is submitted. To ensure that the greatest number of applicants can receive assistance during this challenging time, the amount of your Advance will be determined by the number of your pre-disaster (i.e., as of January 31, 2020) employees. The Advance will provide $1,000 per employee up to a maximum of $10,000.
You may be eligible for another loan program, the Paycheck Protection Program, which is available through participating lenders. Below is a comparison of the two loan programs:
Paycheck Protection Program Full EIDL Loan
PURPOSE
Forgivable if used for payroll (minimum of 75% of the funds received) and the remaining for certain operating expenses (amount of any EIDL advance is not forgivable)
To meet financial obligations and operating expenses that could have been met had the disaster not occurred (amount of any EIDL advance is forgiven)
TERMS
Up to $10 million1% interest rate
Up to $2 million3.75% for businesses2.75% for non-profits
Information on available resources may be found at www.sba.gov/coronavirus. For more information on these services, please go to www.sba.gov/local-assistance to locate the email address and phone number for the nearest SBA district office and/or SBA’s resource partners.
There are two programs for small business owners, the EIDL loan/grant and the PPP (payment protection plan) loan. Both offer assistance for small businesses. Information is coming out rapidly and the details do seem to be changing slightly as it comes out.
EIDL – Economic Injury Disaster Loan
This loan is taken out directly from the SBA and this is one of the better summaries I have found:
EIDL mainly required businesses to have less than 500 employee and the corona virus has qualified the location for all 50 states. In addition to employer (corporations) it also includes:
Sole Proprietors
Independent Contractors
and Self Employed people
Approval conditions:
Borrow up to $200k without personal guarantee
1st year tax return not required, can borrow based on credit score
Do not have to prove you cannot get loans elsewhere
$25k or less loans require no collateral
Must allow SBA to review tax records
The biggest benefit was the $10k advance that would be a grant and should arrive within days of filling out application. Unfortunately, at this time, it appears that the SBA has been overwhelmed and they are running slow getting them out.
Highlights, 1% fixed rate loans for small businesses. All Loan terms are the same for everyone.
Loan amounts can be forgiven for:
The loan proceeds are used to cover payroll costs, and most mortgage interest, rent, and utility costs over the 8 week period after the loan is made; and
Employee and compensation levels are maintained.
Payroll capped at $100k for each employee.
The funds are run through SBA Lenders (your typical banks and credit unions usually). The tricky part is that it appears the banks are only helping their current customers.
If you think either program may apply or help you. Please contact me and we can review your situation.
** The information on this website is intended only for informational purposes. Reh Wealth Advisor clients should discuss with their advisor if any action is appropriate.
Today saw the largest one day drop since 1987 as fear of the corona virus hit the markets. Most market indexes are now down 20% from their high which is what qualifies as a market correction. In 1987, the market dropped over 22% on what is referred to as “Black Monday”.
When Was the Last Market Correction?
Our last market correction of 20% occurred less than 2 years ago in the second half of 2018. It was not as fast as this most recent drop, but markets recovered very quickly in 2019.
Wait, why are some outlets saying we haven’t had a correction since 2008?
I really do not know. They seem to be ignoring the definition of a market correction which by definition is a drop of 20%
How Quickly did we recover from 2018’s Drop?
By April of 2019, the S&P500 had fully recovered from the 20% drop that occurred from late August through December of 2018.
Do you see any other times in history that might be a guide?
I do see some parallels with 9/11 in that the world as we previously knew it seemed to be changing and we faced fears we had not seen before.
Due to fear and concerns over the financial firms inside the World Trade center the stock market stopped trading until 9/17. The NY stock exchange opened on 9/17 with a 7% loss and continued to lose over 14% for the week. It was one of the largest 5 day losses the market had seen.
Less than one month later the stock market had regained its pre 9/11 levels
What do I mean by 2008? I mean another “worst stock market of our lifetime” period. How long did it take to recover from the 2008 stock market?
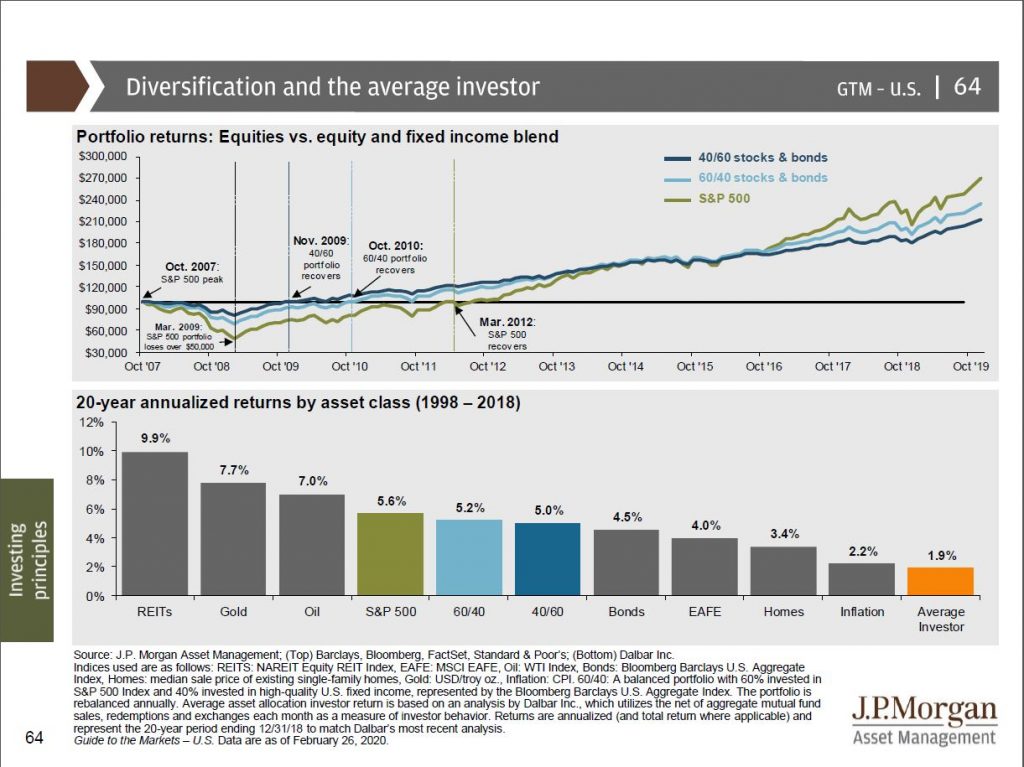
The recovery came swift and a return to value
40% stocks/60% bond portfolio recovering by November 2009
60% stocks / 40% bond portfolio recovering fully by October 2010
The 100% stock S&P500 recovered full by March 2012
The Takeaway
Time periods like we are experiencing now are very challenging for investors. Time periods such as we are in now are tempting to feel that there is no relief in site. However, looking at history, we can see that the stock market, our economy, and country have recovered from even the worst of time relatively quickly. Its persisting through times such as we are in now that allows up to capture the upside of investing. Market timing is tempting and “feels right” when times are rough, however, research has shown us that market timing is extraordinarily difficult (need to be correct over 70%-80% of the time) and in most cases, trying to time the market has hurt our portfolio returns. We are reminded of the “average investor” returns the past 20 years from this slide:
Had the average investor since 1998 simply picked any other the other asset classes and stuck with it, they would have performed better. Further, they did not even outperform inflation.
I will continue to be vigilant in monitoring your portfolios and to ensure we are acting in prudent matters. Please do not hesitate contacting me if you have any questions.
10 Year Treasury Approaching 1% could result in lower 30 year mortgage rates in history
The 10 year Treasury Impacts the 30 Year Mortgage
The rates on the 10 year treasury bond is linked closely to 30 year mortgage rates. The simple reason is that mortgage bonds (bonds issued by quasi government entities Fannie and Freddie) compete with the 10 year treasury bond with investors. If the 10 year rate drops, the mortgage bond rate is not far behind and then mortgage rates to consumers are not far behind.
Why have rates not dropped already
Simply, its too soon. The 10 year dropped extremely quickly and mortgage bonds take time to issue and until there is stability in rates (meaning its expected to remain relatively stable), then lenders issuing the bonds will feel more comfortable locking in home refinances at lower rates. Current mortgage rates are around 3.5% but a 1% 10 year, implies that we could see rates approach 3% for 30 year loans.
What should I do?
I am of the belief that any time you can enough of a rate advantage to be worth your time in filling out the paperwork than your should refinance. If rates are better today than your current rate than refinance today. I would not wait for rates to get better. While the 10 year dropped dramatically in a week, it can just as easily reverse course.
One quick item to note. I generally believe in zero cost refinances. You will take a slightly higher rate but the costs to close on the loan will cost you nothing. It makes the math MUCH easier to compare with your current loan (is the rate less?). It also removed the “how long do I have to keep the loan to make the refinance worthwhile” because you immediately benefit from the lower rate. I have also found that those people that pay points to get a lower rate or even who have to pay out of pocket to refinance, are reluctant to refinance their mortgage again even when there is clear advantages.
Its the old “sunk cost” aversion. What that means, is that I paid $3k for my last refinance, I don’t want to lose that money by refinancing. The reality is that 3k is gone and part of the last mortgage. In finance and accounting we call it a sunk cost. It called a sunk cost because it should not affect a future decision to refinance because that cost affect your previous loan and not your current loan.
By taking a slightly higher rate and receiving “negative points” (cash back from lender), the refinance costs you nothing and you can continue to refinance as rates drop without the costs of the loan hurting you.
Any clients should call me whenever thinking about a refinance and I can help advice you on the best loan for you and your goals. I do not sell loans but help you sort through and decide on the best course of action with whomever you use for your refinance.
Today (2/24/2019) the Corona Virus impacted stock markets driving market indexes down more than 3%. Fears of the impacts of the virus results in a relatively large one day drop for the stock market. I wanted to review past Epidemics to help calm investors and understand the risks to their portfolios and the most prudent action going forward.
Past History lessons of Health Epidemics with the US Stock Market
Epidemic
Month end
6-month % change of S&P
12-month % change of S&P
HIV/AIDS
June 1981
-0.3
-16.5
Pneumonic plague
September 1994
8.2
26.3
SARS
April 2003
14.59
20.76
Avian flu
June 2006
11.66
18.36
Dengue Fever
September 2006
6.36
14.29
Swine flu
April 2009
18.72
35.96
Cholera
November 2010
13.95
5.63
MERS
May 2013
10.74
17.96
Ebola
March 2014
5.34
10.44
Measles/Rubeola
December 2014
0.20
-0.73
Zika
January 2016
12.03
17.45
Measles/Rubeola
June 2019
9.82%
N/A
—Source: Dow Jones Market Data
Note: I borrowed that table and information from the marketwatch article.
As we can see of the 12 previous epidemics, only one had a 6 month negative return for the S&P500 (HIV/AIDS 1981 0.3% Loss). Only two epidemics had negative returns over the next 12 months (HIVE/AID 1981 16.5% loss, and Measles/Rubeola 2014 with a nearly flat 0.73% return).
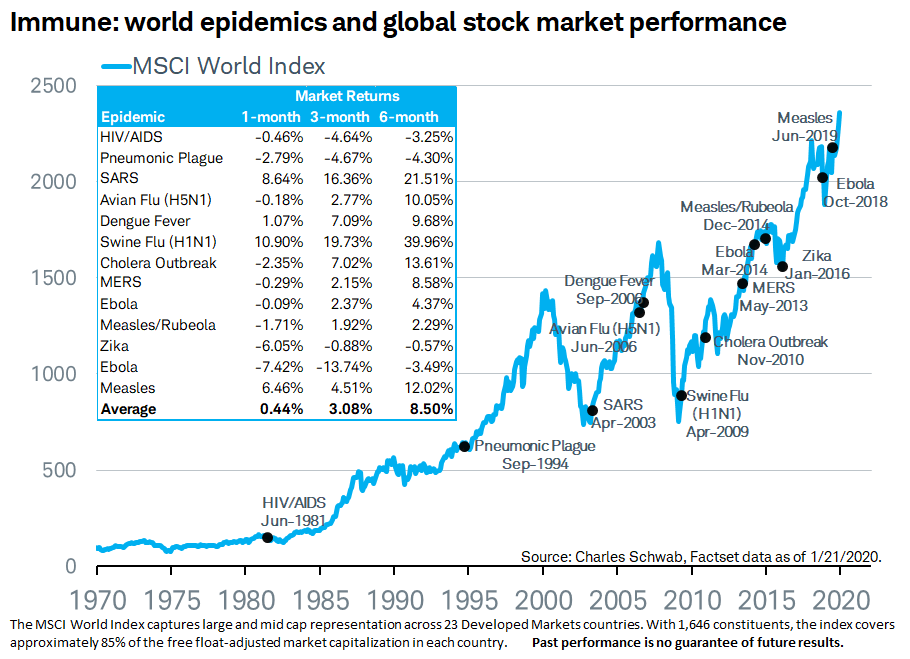
World Stock Market Impacts
Great Chart from the Market Watch Article
The above chart I also took from the market watch article. This chart shows the world market return as many of these epidemics started outside the US. As expected, the performance was worse than the US market, however some interesting findings are there.
Average returns are not just positive over the 1 , 3, and 6 month periods, the 6 month average return is an impressive 8.50%
9 of 13 periods showed a loss over a 1 month period
4 of 13 showed a loss over a 3 month period
The same 4 epidemics showed losses over the 6 months period, with losses of 3.25%, 4.30%, 0.57%, and 3.49%. In all cases, these 6 month losses are fairly tame.
Conclusion – Epidemics historically have had minimal risk to portfolios
While its always possible “this time is different”, history has show us that epidemics are likely the least cause for worry for our portfolios. The fear is that we could have another black plague that devastated Europe and Asia in the 1300s that killed 20 million people in Europe (1/3 of the population). However, modern sanitation and public health practices has mitigated the black plague. The combination of modern medicine, health practices, and modern sanitation greatly reduce the odds of another mass plague.
So while the Corona Virus is scary, the odds are your portfolio should weather this threat well. While we cannot predict the future and the risk that “this time is different”, the past epidemics in modern times have had minimal impact on portfolios. As is usually the case, maintaining market risk/exposure is the prudent course of action and the calm/patient investor will most often be rewarded.
** The information on this website is intended only for informational purposes. Reh Wealth Advisor clients should discuss with their advisor if any action is appropriate.
In the closing months of 2019 Congress Passed the Secure Act and it has some relatively large impacts on retirement savings and retirement plans going forward. I have read several articles digesting the impact of the act but I think Fidelity has put together the best article that details the impacts fairly well.
Require Minimum Distribution Age has been changed to 72 from 70.5
This only impacts those that have not started RMDs. Those who started RMD’s in 2019 will need to continue to do so even if they are younger than 72
As a reminder this is the age you MUST start taking distributions from your retirement accounts that are tax deferred (Roth’s are post tax and are not subject to RMD’s as of the time of this article).
Removed the age limit on Traditional IRA contributions (still required earned income)
If you worked part time > 1000 hours in one year or > 500 hours over 3 years, you are now eligible for your employers 401k.
Parents can withdraw Penalty free up to $5k from retirement accounts the year of a child’s birth or adoption
NOTE – This will still be subject to income taxes
Basically killed the “stretch” IRA. If someone inherits an IRA that is a non-spouse, funds must be distributed and pay tax with 10 years
Added a tax credit for small businesses starting a retirement plan
Allows up to 10k to be distributed from a 529 plan to pay down student debt.
If you have any questions on how this may apply to you, please do not hesitate contact me. Please note that the information from this post is meant to be educational and should not be considered advice. Clients should contact me to receive specific advice on your situation.
It does not appear any new paperwork will need to be done
New competition will keep pressure on costs even with TD/Schwab size
We use TD because they provide great service for a great price. If the Schwab does not continue to provide great service and value, we have other options
Longer Version
TD Ameritrade and Schwab have announced intentions for Schwab to acquire TD Ameritrade. I do not see a huge difference that will impact any of the experiences my clients face as a result of this merger. My concerns are more that two of the largest discount brokerages are combining forces and I wonder what the impact will be for consumers in general.
Pricing Competition has been good for us
TD Ameritrade and Schwab have both reduced transaction fees for
stocks and ETF’s to zero which has been great for consumers. The competition between them has been great
for the consumer.
The reduction to zero was not a result of TD and Schwab competition. A new upstart called Robinhood was the putting pressure on the discount brokerage houses like TD and Schwab so they really had no choice but to match. Schwab dropped prices at first then TD followed.
What has past acquisitions taught us?
We can also look at past history. TD was the result of a merger between Ameritrade and TD Waterhouse. After the merger we have only see cost for financial transactions decreasing and we will likely see that continue. When Scottrade and TD combined, we did not see costs increase in the industry either.
There are still other competitors and new ones entering the industry
On the RIA advisor custodian side (brokerages that work with firms that are independent Registered Investment Advisors), we are seeing the two largest RIA custodians combine and that competition reduce. However, E-Trade has been growing their advisor solution and there are rumblings of Vanguard also re-entering the space. The end result will hopefully be continued competition which is good for all.
Minimal Impact for us
At this time, I do not see merger being bad or good
news. I never like to see our choices or
options reduce. I have also spoken with
TD and they have told me the combined Schwab and TD firm is committed to serving
advisors like me and my clients.
You are unlikely to have to redo account paperwork (Scotrade clients did not need to “repaper” accounts). After the acquisition completes, you will likely have to use Schwab’s client portal and will start receiving statement that say Schwab instead of TD Ameritrade on them.
If you have any questions or concerns please do not hesitate reaching out to me.
The S&P500 has now officially dropped 20% from its market high. It has exceeded the 14% on average drop. Its now officially a correction. I have said multiples times over the past 10 years that most pullbacks are temporary and we should not try to time the stock market. That has proved wise as we experienced a 16% drop in 2010, a 19% drop in 2011, a 10% drop in 2012, 12% drop in 2015, 11% drop in 2016. Each of those times, we were better off assuming things would not get worse.
Last September/October when I wrote that we need to be patient as the drop in the market could be a false alarm as it was the previous times. This time was indeed different and the market dropped quickly in December of 2018. So now, what do we do?
Too Late Market is ALREADY predicting a minor recession
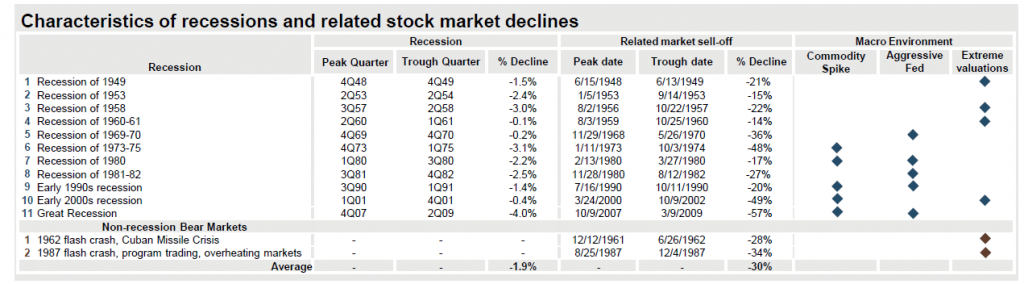
The stock market is a LEADING indicator for the economy. The economy currently as of today, is still showing strength. Unemployment is low and earnings are up. Why is the market dropping then? Future expectations is the answer. With rising interest rates from an aggressive Fed, “the market” is predicting that the economy will worsen and earnings will drop and unemployment will get worse.
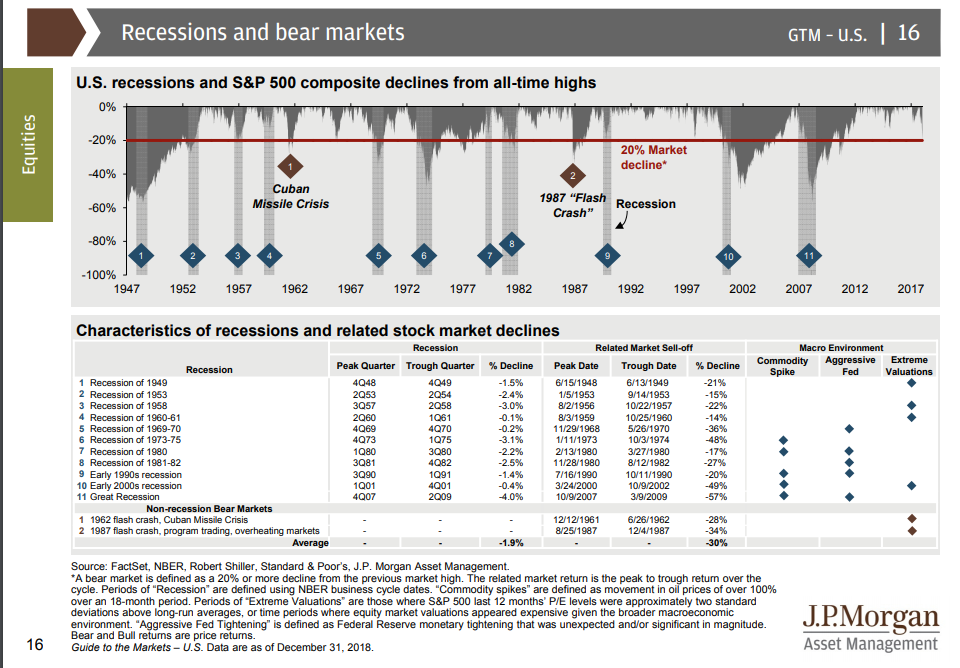
As you can see from the chart above, there are some examples where the markets sold off even more than what we have seen.
Great Recession of 2008- a 57% drop Early 2000s (dot com bubble bursting) – 49% drop Recession of 1973 – 48% drop Recession of 1969 – 36% drop
We also had a couple of non-recession bear market drops of 28% and 34%.
Realistically, I think the Great Recession and the Dot Com bubble bursting were two historic events that are likely outliers. Which means if we use history as our guide, we are at a 20% drop and may have some room to drop further but we have likely already seen the worst of it. Is it possible it drops another 30%? Yes but I feel its less likely that being less than 10%.
Market Could Recover at any moment but the longest it should take until the drop stops within 1-2 years of starting
The market hit its most recent high as of August 29th 2018. If we look at the previous chart, most drops end within a year and nearly all within 2 years (dot com bubble lasted a little longer). We are already 3-4 months into this drop. The market could recovery at any moment and return to positive returns. The valuations currently look better than they have for years.
For those arguing that “I don’t have time to make up if it drops more”, even if it lasts on the long side at 2 years, you still are not drawing the majority of your portfolio within the next 2 years. You can wait this out and you will likely be better off for it as when you exit the market, then you will be faced with a tough decision of when do you re-enter. Its important to understand the reversal can come at ANYTIME within 2 years. It could have already started the recovery and we don’t know it yet. When markets reverse from a downturn, they often reverse VERY quickly and experience the largest gains in the beginning when many doubt whether the recovery is real.
Where are Valuations Now?
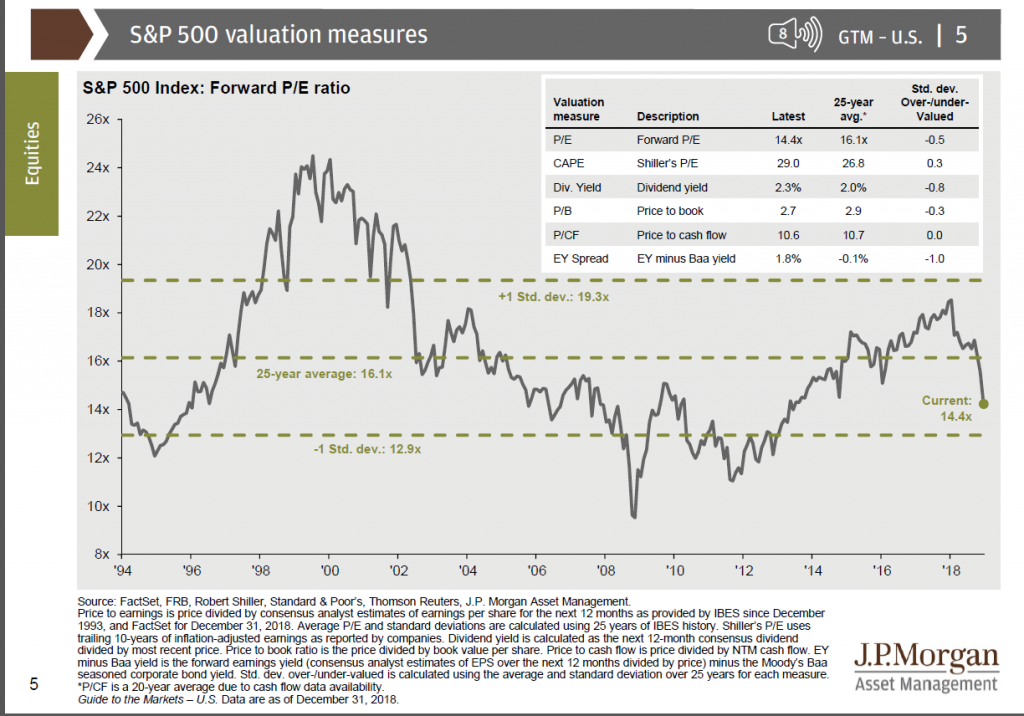
Most metrics show valuation are undervalued
Looking at the above chart from JP Morgan we can see the past 25 years this market drop has made several measures report that the market is now undervalued. Foreward P/E, Dividend Yield, Price to Book, and earnings yield less Baa bond yield all show a market that is undervalued relative to the 25 year average. The only metric showing the market might be slightly overvalued is the Shiller P/E ratio which uses 10 years of earnings data so its tells us less about where we are now and more about how the past decade compares.
On the whole, I feel better about the valuations of the market than I have in a long time. Bear in mind, these numbers indicate that either 1) market will go up or 2) that a recession is coming and fundamentals will deteriorate relative to prices.
What do we do?
I hate to say nothing but the most prudent action is to review our risk allocations and make sure our portfolios still meets our investment objectives. Valuations look very attractive currently and I do think the outlook for the market is better than it was 1 year ago. It may sound odd but the 20% drop is HEALTHY for the stock market. It reminds investors there is risk that goes with reward.
The market has survived much worse times than the ones we are facing now and it will survive this one as well. The most difficult and critical component to success will be sticking with a long term investment plan and not letting market corrections derail the success of your plan.
I will continue to work hard for you to help you reach your goals and perform actions that are supported by research to help you continue to make good decisions with your finances.
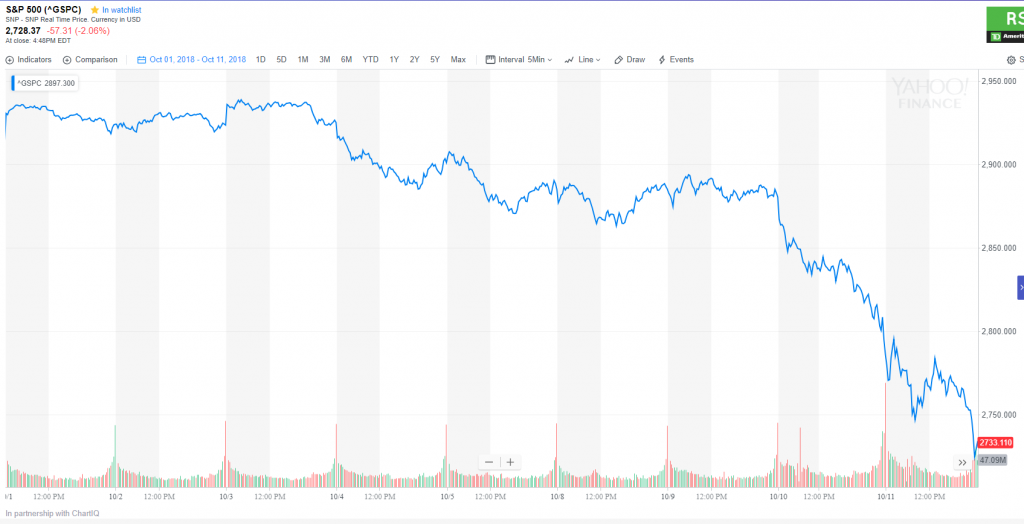
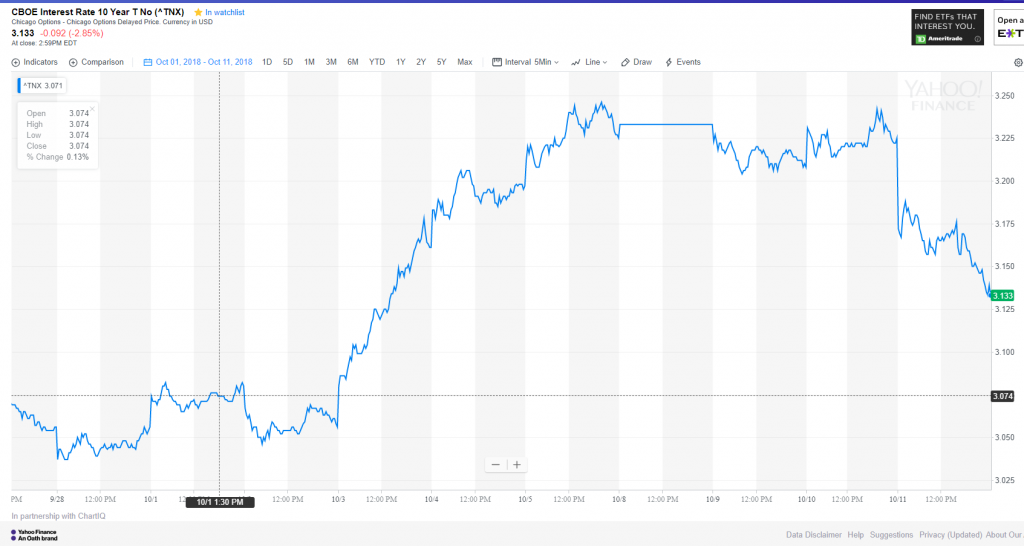
Market Jitters are back. The stock market pulled back strongly the past few days as shown in the following chart.
SP500 Chart October 2018 ytd
What is happening and should we be concerned?
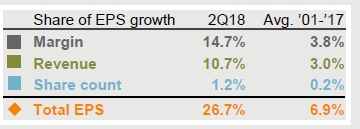
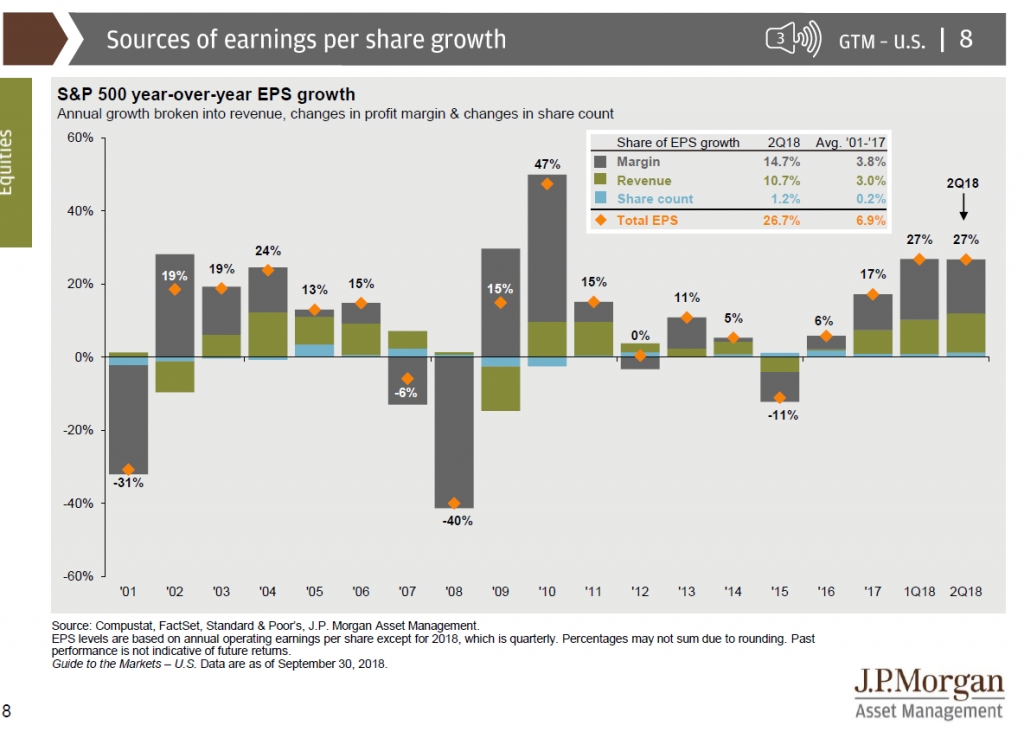
Corporate Earnings Growth Has Increase Dramatically
Earnings per share (EPS) has averaged 6.9% from 2001 through 2017. In the first and second quarter of 2018, EPS grew dramatically at 27%. The growth was a combination of both better margins and higher revenues.
Wait, Is Earnings Growth Bad?
No growth is not bad. However, when earnings grow quickly it raises concerns about inflation. Bond investors seeing that growth became fearful of inflation started selling off bonds. The 10 year treasury bond increased very rapidly. (Chart below shows yield increase on 10 year bond from 3.05 uo to nearly 3.250 before decreasing as stocks sold off).
Higher Bond Yields Bad for stocks
Stock investors seeing yields increase rapidly became fearful that the higher yields would cots businesses more money and hurt earnings. The argument goes that higher yields increase business’s borrowing costs which in turn hurt earnings as expenses are higher than previously due to the debt.
This increase in yield drove the stock market lower as investors felt higher yields would be bad for future returns of stocks.
Is this a small bump or a sign of things to come.
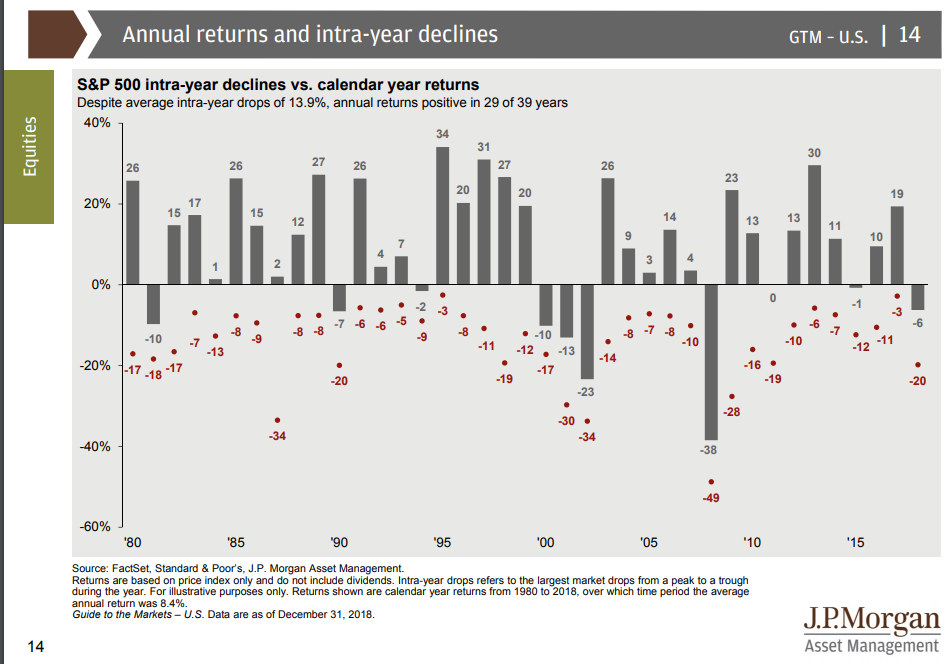
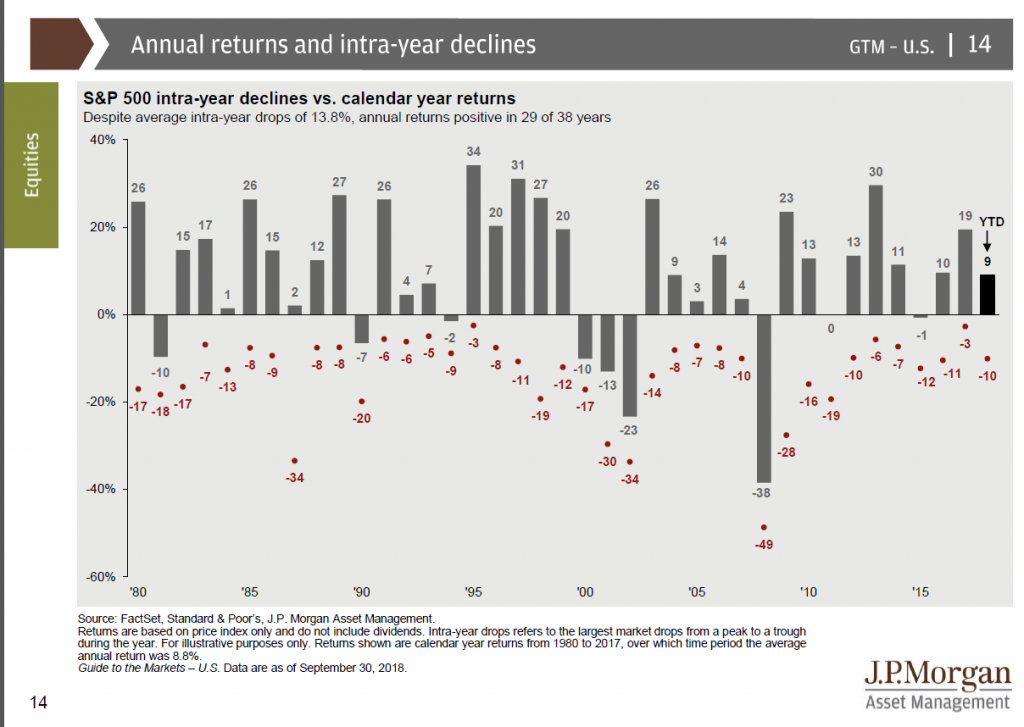
For those that have read my analysis for years, probably already know my answer. It is VERY difficult to predict if there will be a bigger drop. If you just bet “no” and that it was a bump is the road, you would be correct the majority of the time. Every year, the market drops on average almost 14% from the market high and every drop feels like we will go further into recession. At some point, it will not be a false alarm and will be a real drop. However, we will likely not know it until it is over. Trying to predict the next prolonged drop would have cost us dearly the past 10 years as the market quickly recovered several times.
Intra Year Stock Market Declines
Ok, Steve, We will not panic and we will not be tempted to try to time the stock market. What else can you tell me right now?
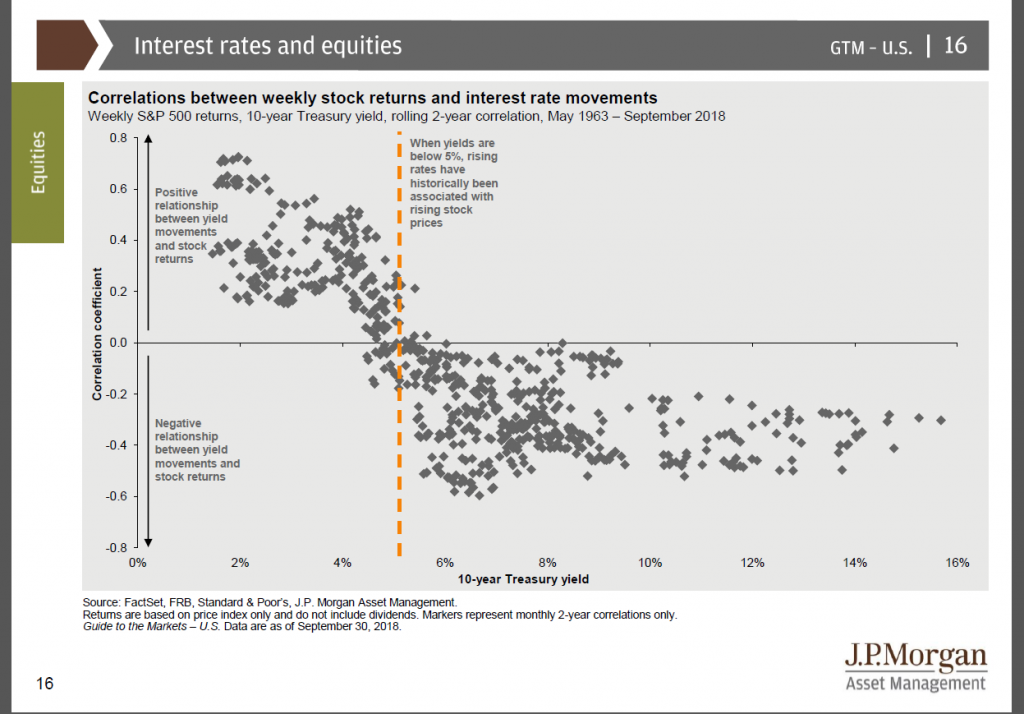
One interesting thing is that history tells us that when yields have been below 5%, an increase in yields has generally been correlated with positive stock market returns as shown by this chart:
Rates and Market Return Correlations
Does this make sense? It does when rates have been below 5%, we typically have been coming out of a period of low rates. Rates would be increases as a response to growth and in general, growth is good for the stock market. When rates are above 5%, that has historically been during times where growth was too hot and inflation was a problem. So rates were raising indicating an overheating economy with runaway inflation or as was the case in the 1970s, runaway inflation with stagnant growth (stagflation).
What if it does get Worse! How bad is it going to be!
First, I really don’t know. However, let’s get some context and see what previous recessions have looked like.
Recessions
Many are quick to assume we will see a 50%-60% drop in the stock market similar to the Great Recession (Financial Crisis of 2008) or the dot com bubble bursting of the early 2000s. However, those two recessions we more anomalies than the norm. The dot com bubble was the recent of irrational exuberance and extreme valuations for stocks and the financial crisis was driven by the fear of our financial system collapsing due to banking risk in mortgages and derivatives based on mortgages. Both events tended to be anomalies in market history. Therefore, I feel we are much more likely to see a 15-30% drop than a 50-60% drop. I would also expect diversified portfolios similar to what I use to go do much less that the 100% stocks, S&P500. So a diversified portfolio dropping in the 8% – 20% range is more likely in my opinion that the large drop we saw in the financial crisis of 2008. So while I can’t guarntee we will not have another 2008, I do think its more likely if we have a further drop, it will more likely be similar to our more tame recessions.
What Should We Do?
Ultimately, we need to stick to our long term plan. It will be nearly impossible to time the next big drop in the stock market. Should we try, we are more likely to make the call incorrectly and hurt our long term returns. Attempting to time the stock market is similar to the old “Siren’s song” longing boats to veer off course and into trouble. I remain vigilent and will continue to position our portfolios to withstand market jitters and help us reach our long term goals. If you have any questions, please do not hesitate asking.
I will leave you with the last few times we had similar articles to reassure you that these drops are common and more times than not, they are not signs of worse things to come.
PLEASE DO NOT HESITATE CONTACTING ME IF YOU HAVE ANY QUESTIONS.
** The information on this website is intended only for informational purposes. Investors should not act upon any of the information here without performing their own due diligence. Reh Wealth Advisor clients should discuss with their advisor if any action is appropriate.
Market Jitters have returned. It has been a long time since we have had a measurable pull back in the markets. This past week we have seen the market quickly pull back. This time is feeling a lot like 2015. For my clients that were with me then, this market pull back will likely feel familiar.
This post is going to be a review of the last pull back and what we wrote in 2015. I will be updating data and writing a similar article this time. The cliff notes version is that this pull back is most likely a pull back and not a recession. It is possible this time will lease to a recession, however, the “odds” are in the favor that it’s simply a pull back. At some point, we will have a pull back that turns into a recession but we are unlikely to know until after the fact.
The market pulls back on average 14% from the market high every year giving an investor a moment to panic or simply be reminded of the risk with investing. So a double digit pull back is not only normal but common.
Pull backs can happen even when markets appear fairly valued
P/E Ratio is a poor predictor of short term performance (1 years) and only “ok” at longer periods.
Market Timing is difficult and rarely works
A quote from the article
“And the Final Reminder – While we try to look at markets rationally, they simply are not rationale in the short term. If investors start to panic and start selling equities and they witness this downturn, we certainly can see a much bigger drop. However, if the fundamentals stay strong, it should prove to be another bump in the road. Pullbacks similar to this are healthy for the market to remind investors that the stock market is risky.” August 24, 2015 blog entry
This article was conceived because there are always good reasons to think bad things can happen. Sometimes, its driven by things that make sense other times, myths.
Myth 1 – Market is going to drop because rates are going up
Despite the logical myth, when the 10 year treasury bond is less than 5%, rate hikes are associated with a higher stock market (not a drop).
This makes sense in that the Fed is shifting from an accommodating policy to a restrictive policy, they are unable to do so unless the economy is on firm footing which usually means a higher 10 year bond yield.
Myth 2 – Companies are Fragile and poised to drop in value
At this time, cash was at an all-time high and dividend payouts were increasing.
Despite share buy backs and dividends increasing, cash was increasing on corporate balance sheets
Myth 3 – Bull Market has run for 7 years and we are due for a major correction.
Fact- 1946 to 1961 had 15 years between bear markets
Fact – 1987 until the Tech bubble we had 13 years.
Myth 4 – Markets Trend Up and Trend Down over intermediate and long time periods
Over intermediate period (5-10 years) markets have generally trended up or flat vs downward trending.
Marketing timing out of the market during a flat period offers minimal advantage vs staying in the market.
These articles compare similarities in 2011 and 2008’s Q3 at that point in time. This article’s point was to argue that 2011’s Q3 , looked as bad or even worth than 2008’s and yet had a favorable outcome. So while we can draw parallel’s to 2008 we also could look at 2011.
The Take Away
We will have stock market pull backs and we will have bear markets. It will be VERY difficult to tell the difference between the two and most times it will feel like a significant bear market is coming. At moments like these, it is important to understand that markets have risk and the risk of a pull back is real but we will have several false alarms before the real bear shows up. Unfortunately in most cases, we will need to participate in the bear market in order to not miss out on the long-term returns of the market.
Do I think we could have a pull back in the 10-15% range? Yes, I think its possible. Do I think we can see a bear market drop of greater than 20%? It is possible but less likely than a smaller drop. I do not see a drop like 2008 as that was a “once in a lifetime” drop, meaning it is the worst we have seen in our lifetime which means its unlikely to be that bad again (of course the possibility will always exist that we could see a worse drop).
** The information on this website is intended only for informational purposes. Reh Wealth Advisor clients should discuss with their advisor if any action is appropriate.