2018 Market Jitters Strikes Again
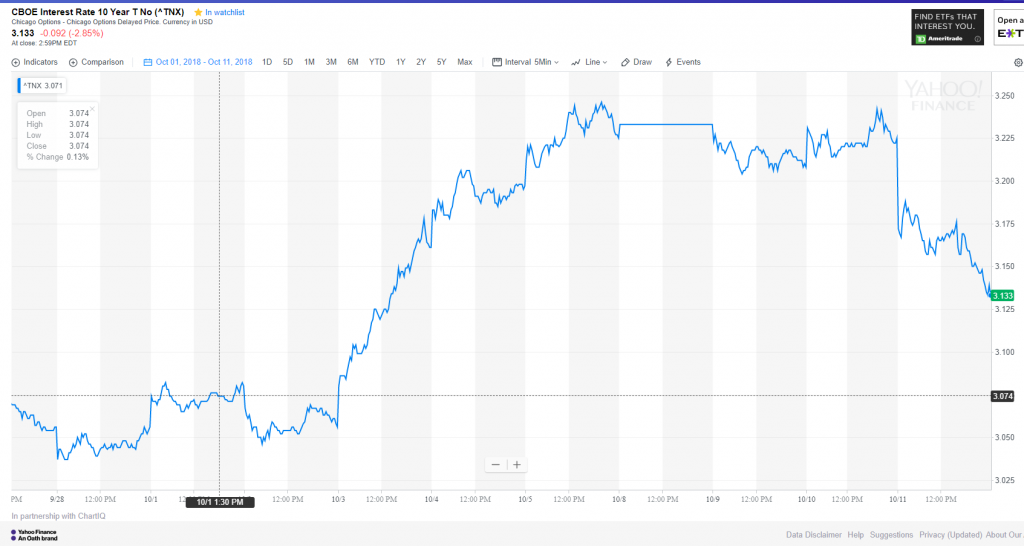
Market Jitters are back. The stock market pulled back strongly the past few days as shown in the following chart.
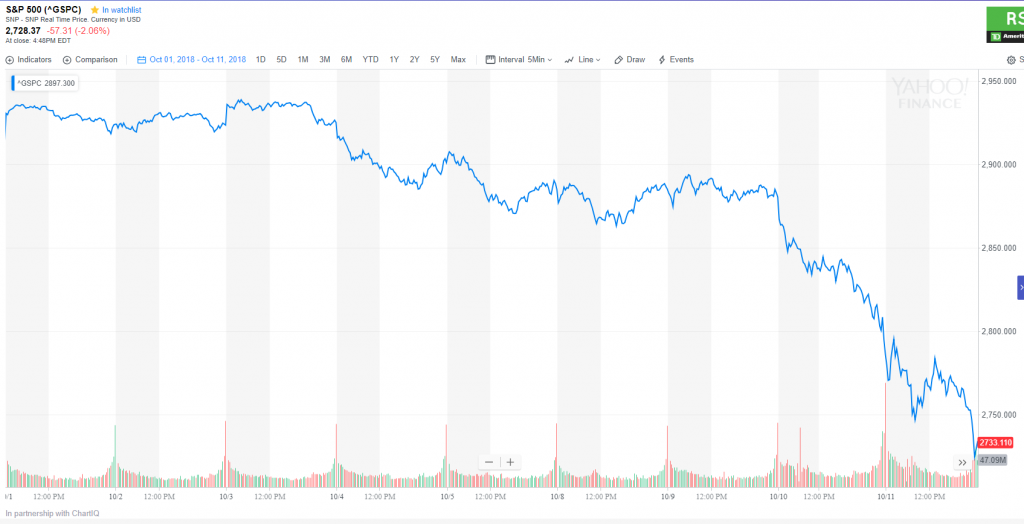
What is happening and should we be concerned?
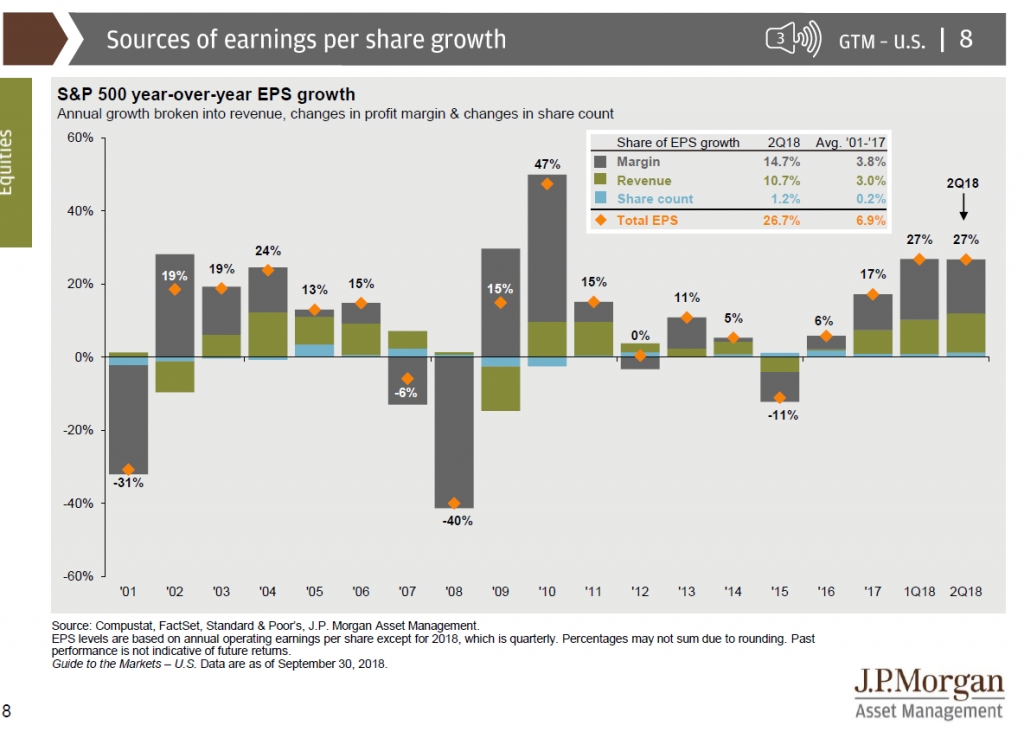
Corporate Earnings Growth Has Increase Dramatically
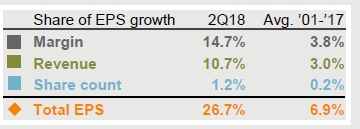
Earnings per share (EPS) has averaged 6.9% from 2001 through 2017. In the first and second quarter of 2018, EPS grew dramatically at 27%. The growth was a combination of both better margins and higher revenues.
Wait, Is Earnings Growth Bad?
No growth is not bad. However, when earnings grow quickly it raises concerns about inflation. Bond investors seeing that growth became fearful of inflation started selling off bonds. The 10 year treasury bond increased very rapidly. (Chart below shows yield increase on 10 year bond from 3.05 uo to nearly 3.250 before decreasing as stocks sold off).
Higher Bond Yields Bad for stocks
Stock investors seeing yields increase rapidly became fearful that the higher yields would cots businesses more money and hurt earnings. The argument goes that higher yields increase business’s borrowing costs which in turn hurt earnings as expenses are higher than previously due to the debt.
This increase in yield drove the stock market lower as investors felt higher yields would be bad for future returns of stocks.
Is this a small bump or a sign of things to come.
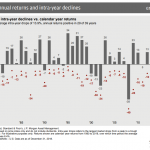
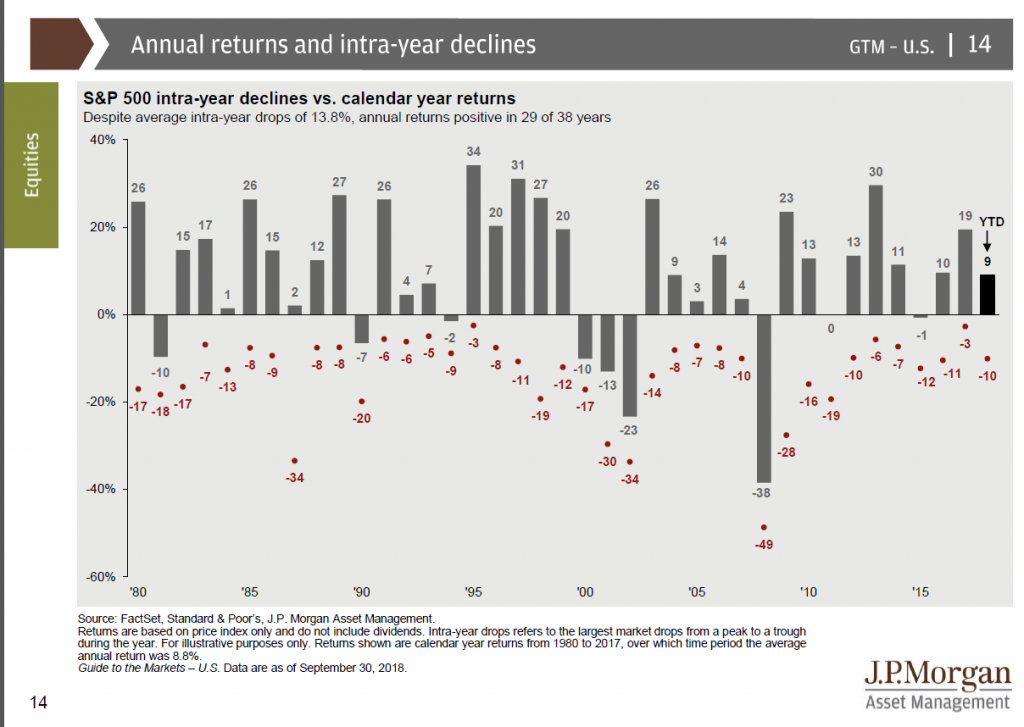
For those that have read my analysis for years, probably already know my answer. It is VERY difficult to predict if there will be a bigger drop. If you just bet “no” and that it was a bump is the road, you would be correct the majority of the time. Every year, the market drops on average almost 14% from the market high and every drop feels like we will go further into recession. At some point, it will not be a false alarm and will be a real drop. However, we will likely not know it until it is over. Trying to predict the next prolonged drop would have cost us dearly the past 10 years as the market quickly recovered several times.
Ok, Steve, We will not panic and we will not be tempted to try to time the stock market. What else can you tell me right now?
One interesting thing is that history tells us that when yields have been below 5%, an increase in yields has generally been correlated with positive stock market returns as shown by this chart:
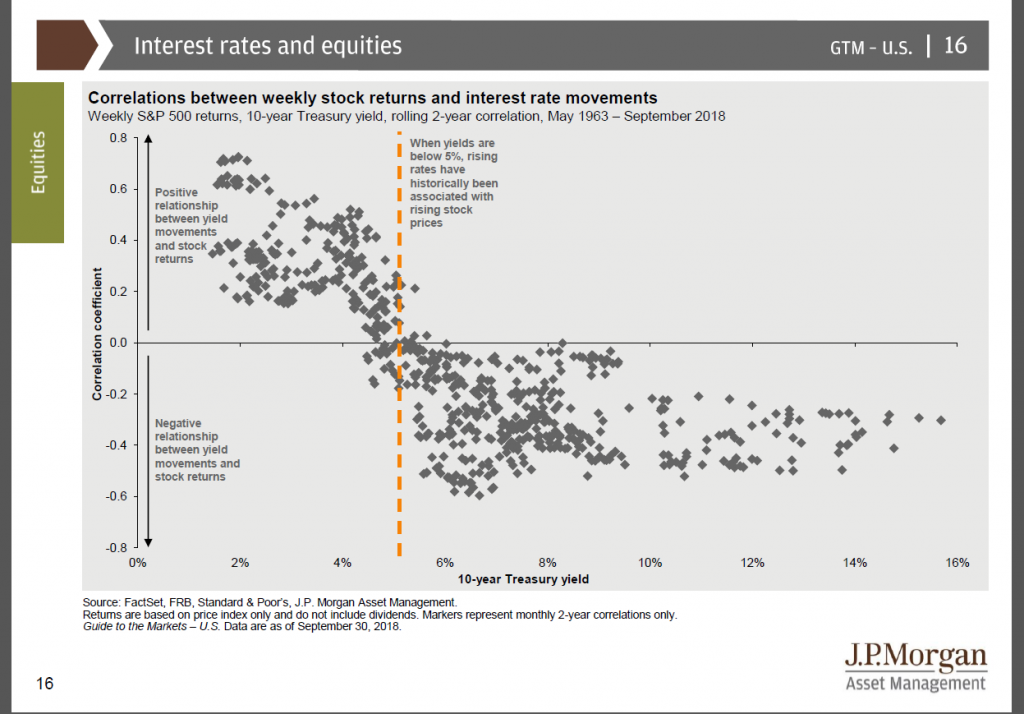
Does this make sense? It does when rates have been below 5%, we typically have been coming out of a period of low rates. Rates would be increases as a response to growth and in general, growth is good for the stock market. When rates are above 5%, that has historically been during times where growth was too hot and inflation was a problem. So rates were raising indicating an overheating economy with runaway inflation or as was the case in the 1970s, runaway inflation with stagnant growth (stagflation).
What if it does get Worse! How bad is it going to be!
First, I really don’t know. However, let’s get some context and see what previous recessions have looked like.
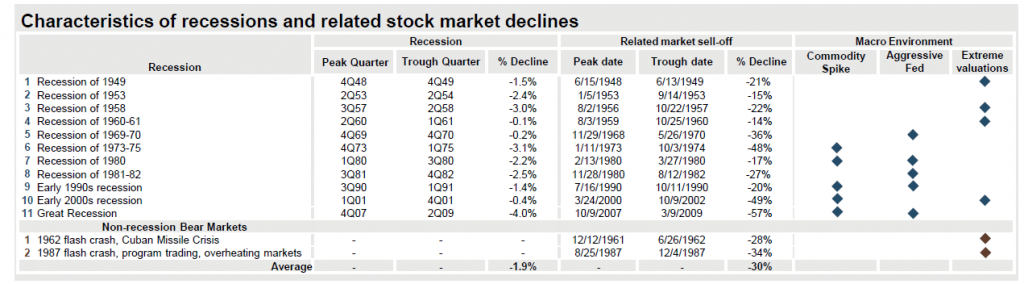
Many are quick to assume we will see a 50%-60% drop in the stock market similar to the Great Recession (Financial Crisis of 2008) or the dot com bubble bursting of the early 2000s. However, those two recessions we more anomalies than the norm. The dot com bubble was the recent of irrational exuberance and extreme valuations for stocks and the financial crisis was driven by the fear of our financial system collapsing due to banking risk in mortgages and derivatives based on mortgages. Both events tended to be anomalies in market history. Therefore, I feel we are much more likely to see a 15-30% drop than a 50-60% drop. I would also expect diversified portfolios similar to what I use to go do much less that the 100% stocks, S&P500. So a diversified portfolio dropping in the 8% – 20% range is more likely in my opinion that the large drop we saw in the financial crisis of 2008. So while I can’t guarntee we will not have another 2008, I do think its more likely if we have a further drop, it will more likely be similar to our more tame recessions.
What Should We Do?
Ultimately, we need to stick to our long term plan. It will be nearly impossible to time the next big drop in the stock market. Should we try, we are more likely to make the call incorrectly and hurt our long term returns. Attempting to time the stock market is similar to the old “Siren’s song” longing boats to veer off course and into trouble. I remain vigilent and will continue to position our portfolios to withstand market jitters and help us reach our long term goals. If you have any questions, please do not hesitate asking.
I will leave you with the last few times we had similar articles to reassure you that these drops are common and more times than not, they are not signs of worse things to come.
PLEASE DO NOT HESITATE CONTACTING ME IF YOU HAVE ANY QUESTIONS.
** The information on this website is intended only for informational purposes. Investors should not act upon any of the information here without performing their own due diligence. Reh Wealth Advisor clients should discuss with their advisor if any action is appropriate.
Alot of the slides were take from
https://am.jpmorgan.com/us/en/asset-management/gim/adv/insights/guide-to-the-markets
and
and