The first thing to note is that its been nearly 3 years since I last wrote one of these articles. You can see the article I wrote in May of 2022 here, https://investwithsteve.com/2022/05/2022-may-stock-market-drop/. This article will mainly be an update with some of the same principles of that article.
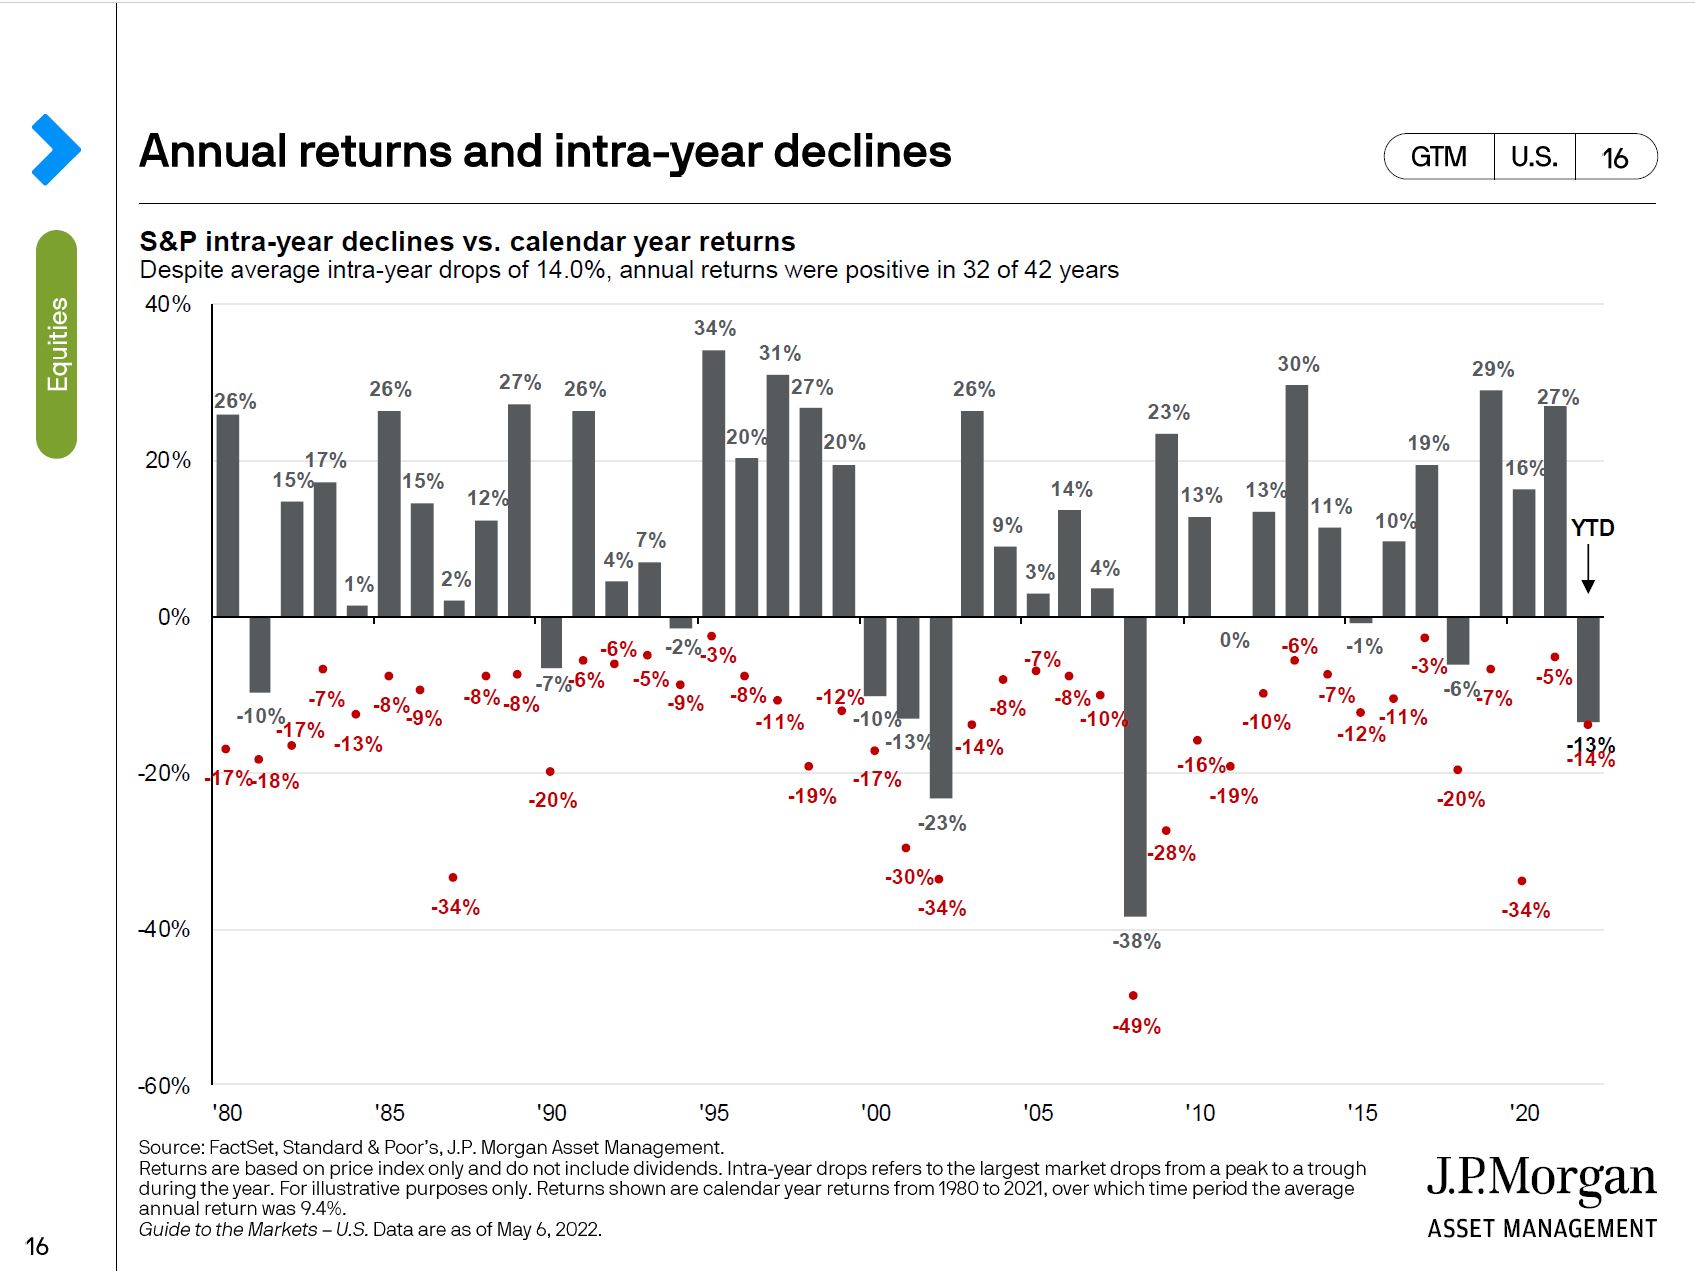
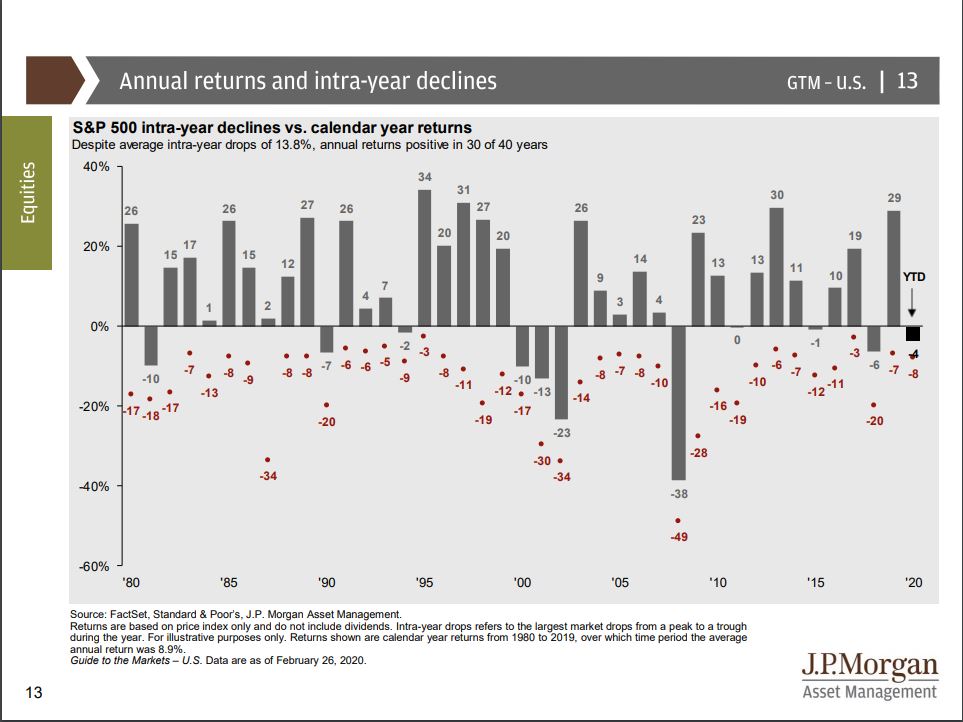
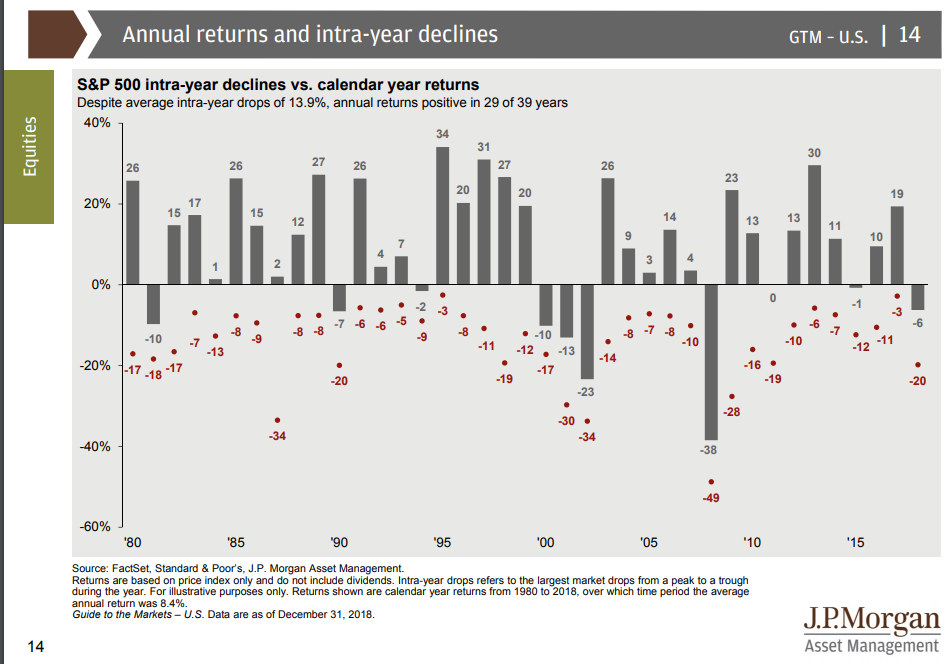
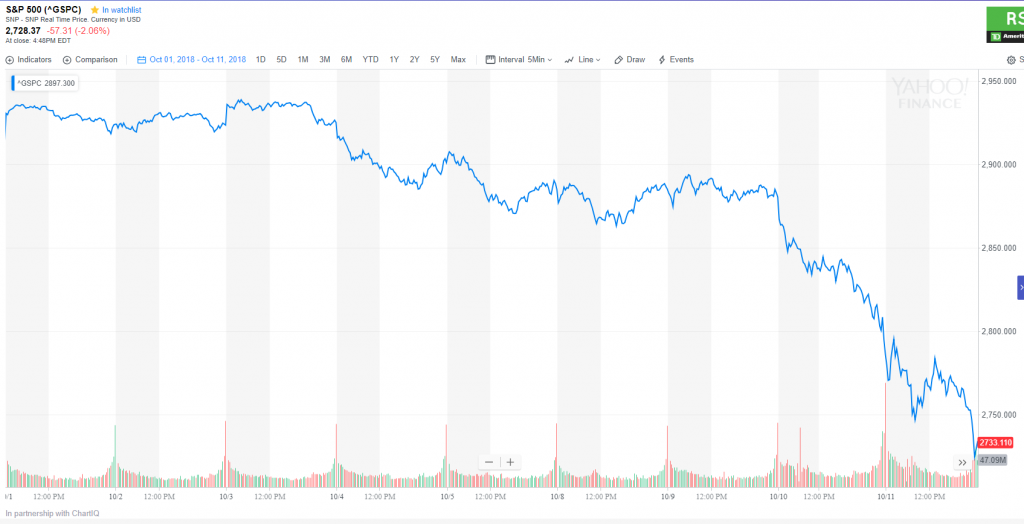
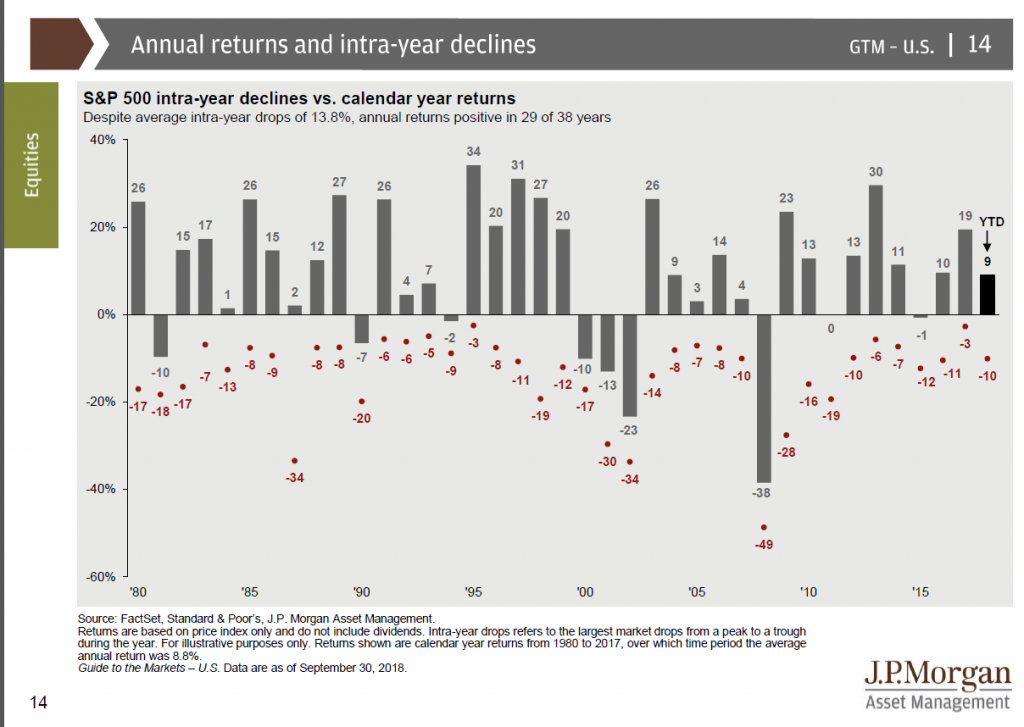
The stock market is nearing correction territory with a 17% drop. Technically, it has not fully reached a correction until it has a 20% drop.
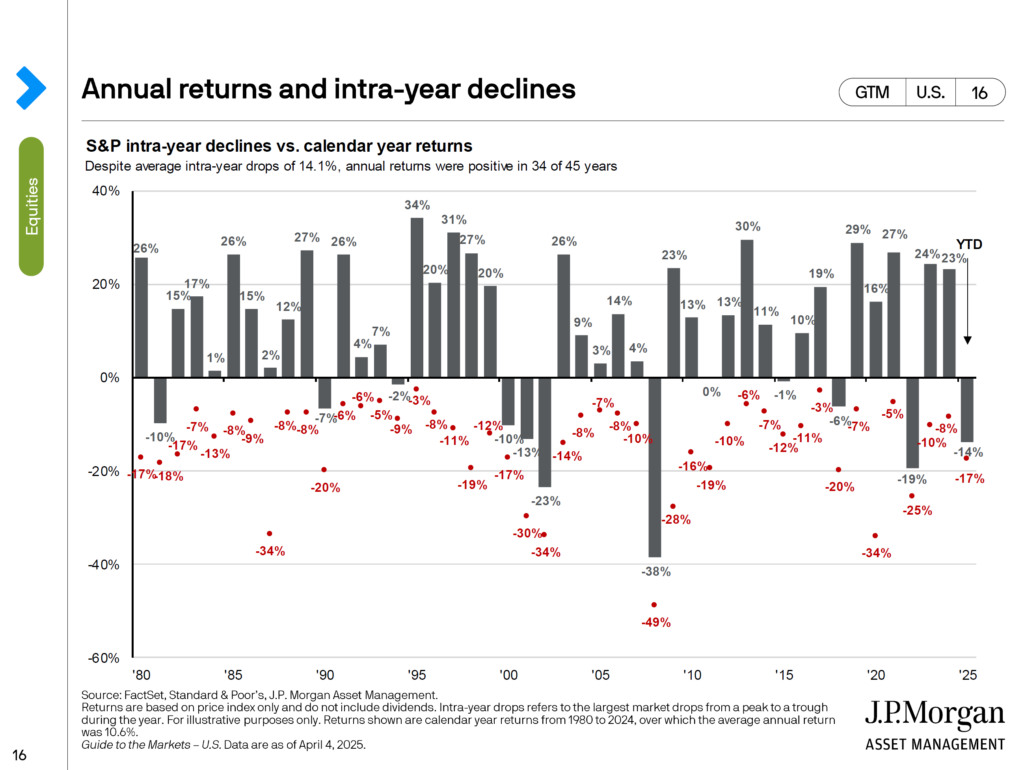
Early in the Year Market Declines “Feel” Worse
Investors often feel that when January 1st hits, the returns earned previously are somehow “banked”, so a drop in the beginning of the year often causes more anxiety than a drop later in the year. When investors see a drop later in the year, they seem to feel some of that drop is “the house’s money”. We realize the fact that a loss is a loss regardless of when it occurs, but it is also important to understand this is human nature. It is perfectly normal for market declines earlier in the year to psychologically impact us more than declines later in the year.
Time, Diversification and Volatility of Returns
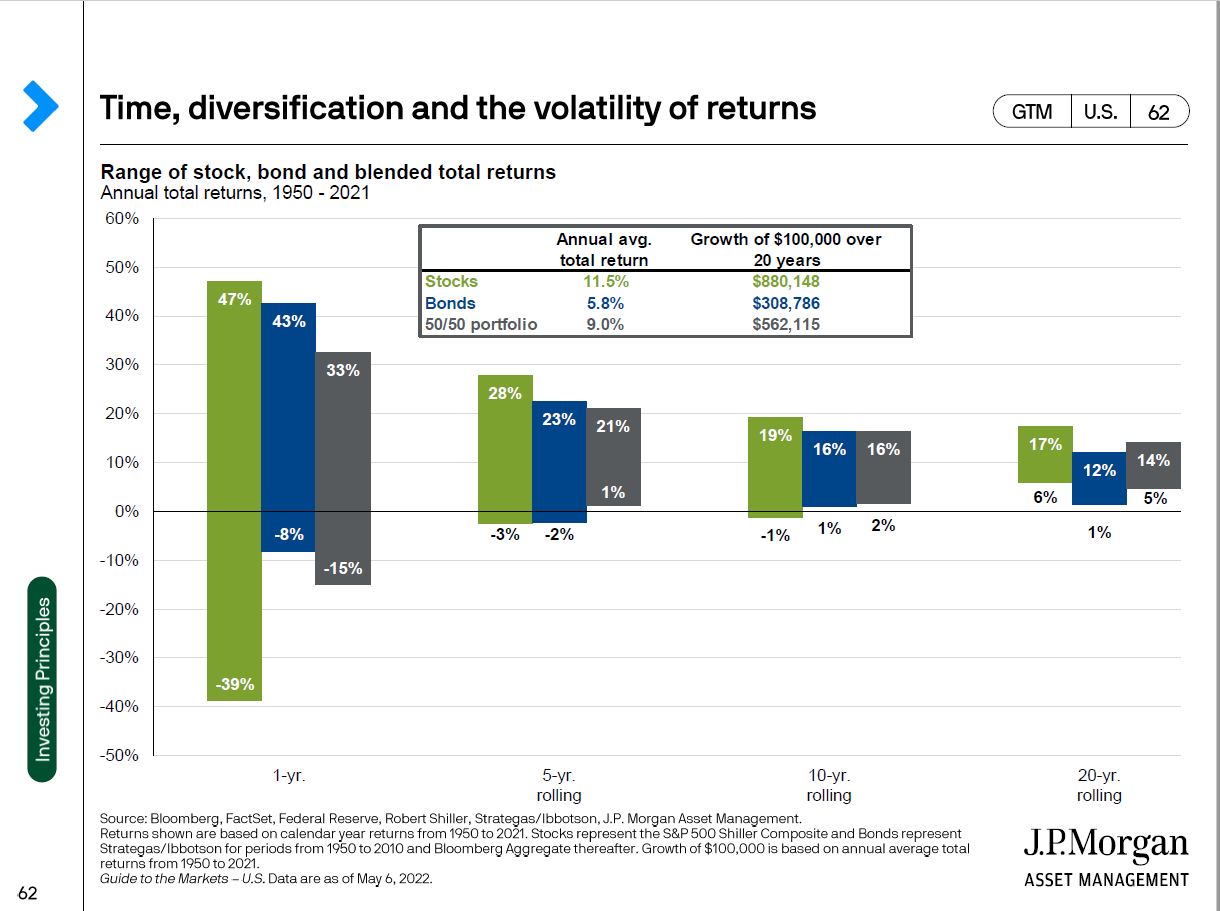
There is a cliche of “invest for the long run”. What does that mean and why is it important? Time is the greatest reducer of risk when investing. I really like the chart that follows:
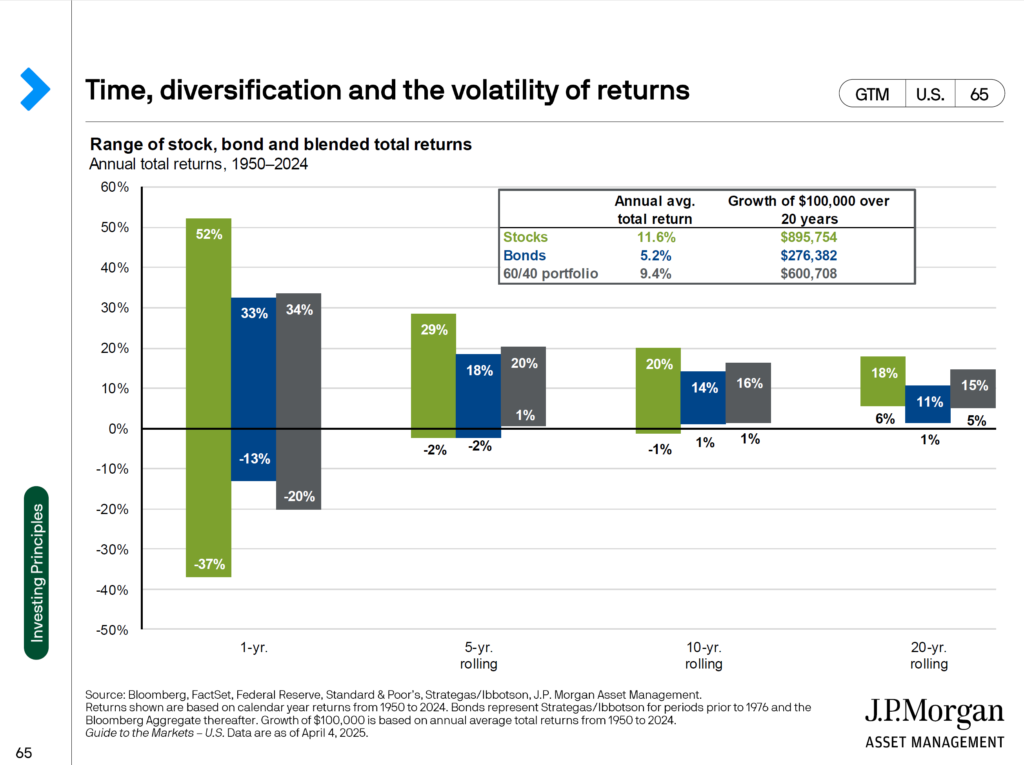
The key take away here is that over a 1 year period, investing aggressively or conservatively, does not save you from loss as much as investing for longer periods of time. Over a 5 year rolling period, the most stocks have lost since 1950 is 2%. If we take a 60% stock portfolio and 40% bond portfolio, it has not lost money over a 5 year rolling period. The range of outcomes and risk is much lower over longer periods of time.
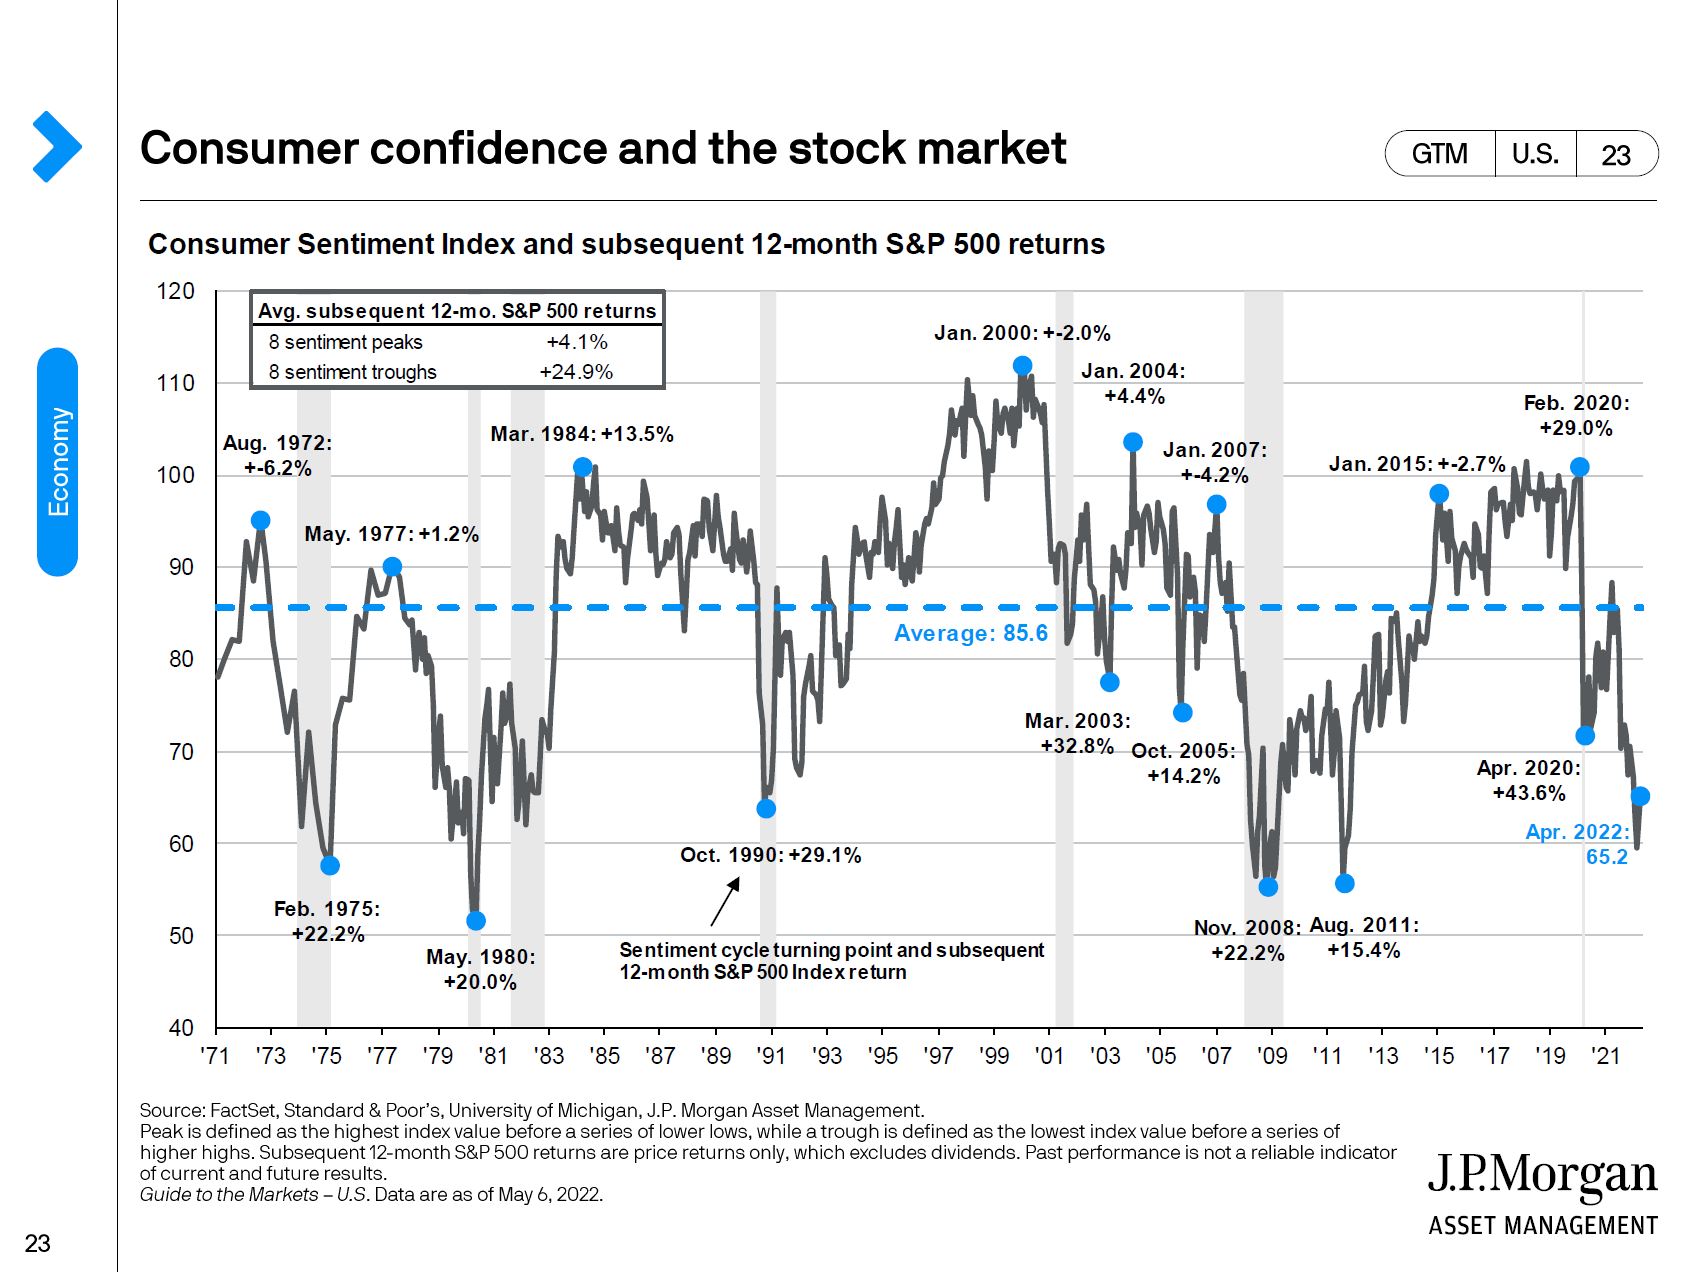
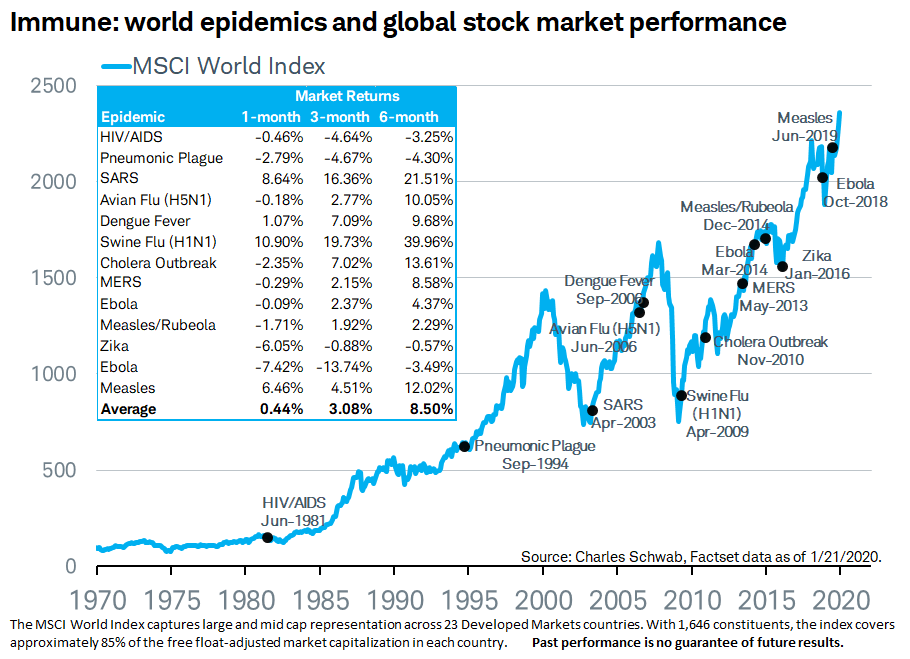
Is this time different? People around me seem really pessimistic?
Interestingly enough, pessimism tends to be good for stocks. If we look at this chart:
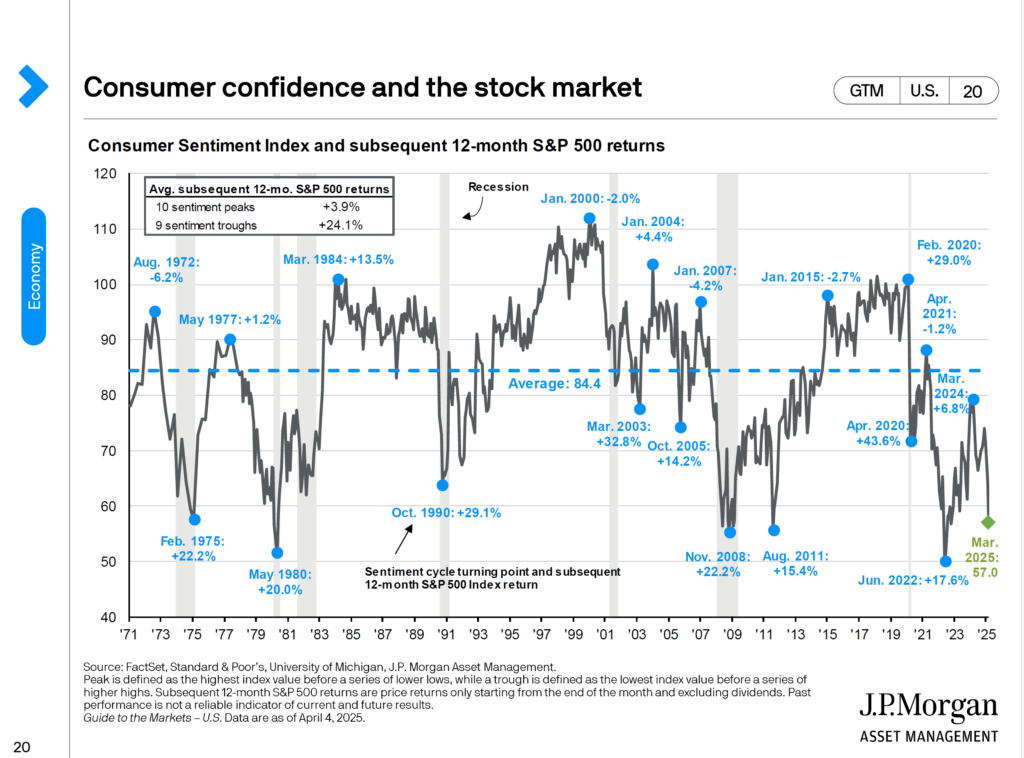
As you can see on the chart above, pessimism usually peaks right before the market takes off. It does make sense. As the market drops, people become pessimistic as a result of seeing the market drop. With the current consumer confidence in the stock market pretty low, it bodes well for future returns.
Do not let the short term ruin your long term investing plans
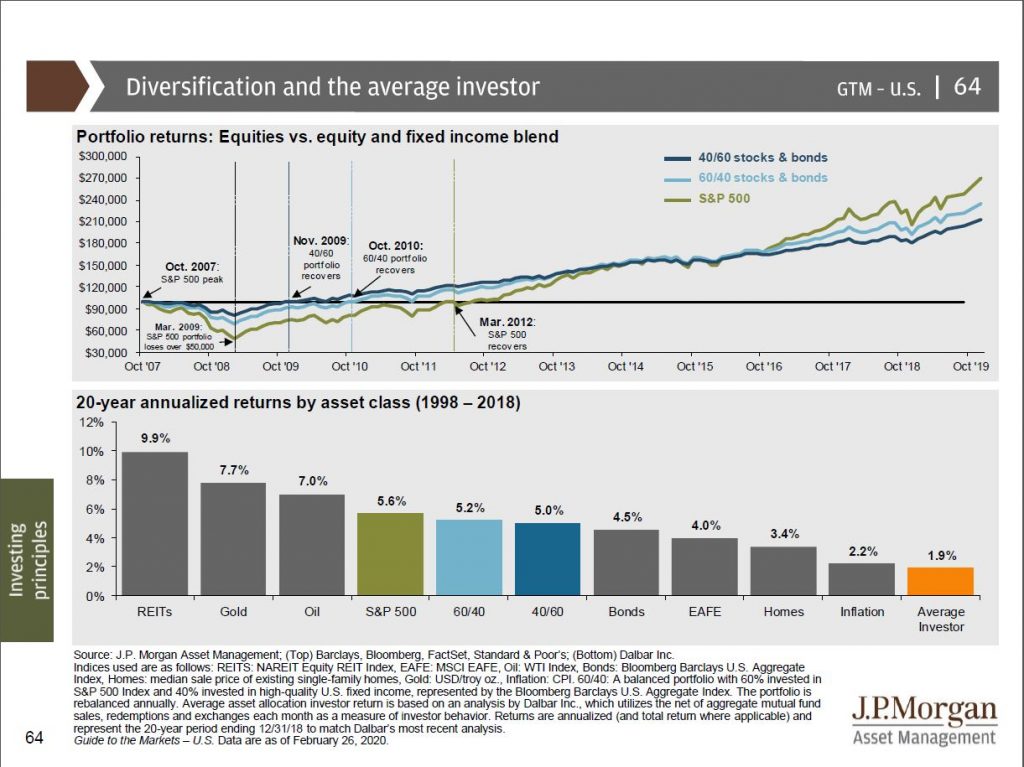
You will find my advice pretty consistent over the years. We can’t let the short term noise of the market impact our long term investing goals. Here is a a chart that I like to look at:
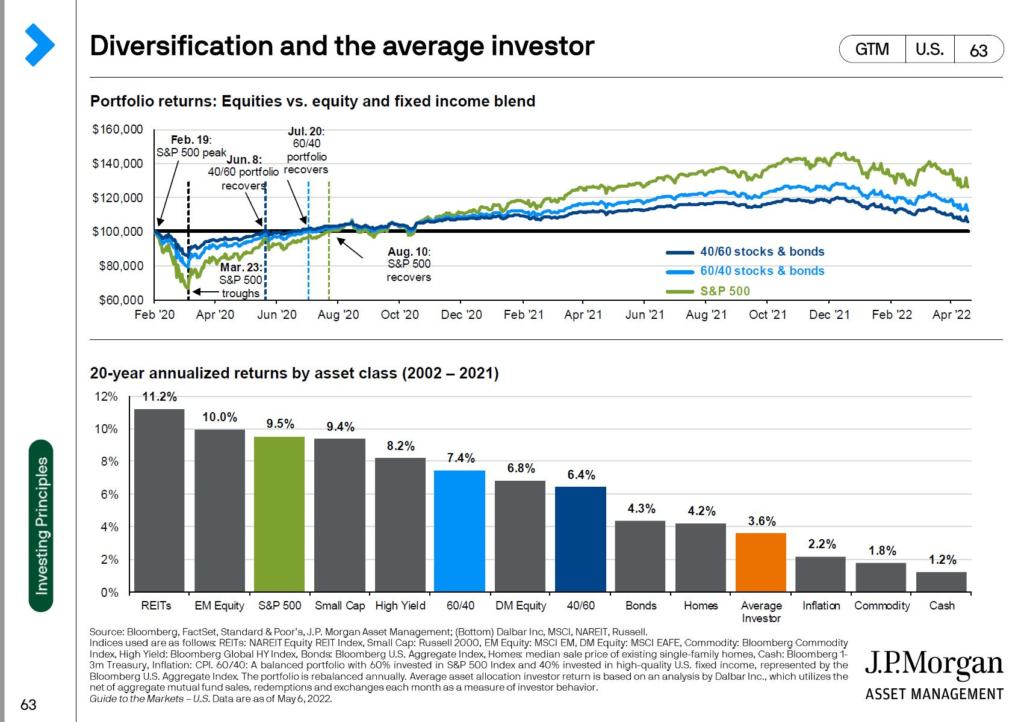
The average investor underperformed most asset classes. Most likely they were attempting to time the stock market. We need to remember that we are investing for the longer term. I know some of you are going to say “I am older and retired I don’t have the time”. I am here to say, “yes you do”. Look at covid crisis. Portfolios tanked massively where 100k was a fraction of its total in March. By June the 40/60 Portfolio recovered, by July the 60/40 portfolio recovered, and by August the market had recovered. Most 3 and 5 years periods, the stats are overwhelmingly in your favor for staying invested.
I am also going to link to several of my previous articles over the years so you can see that what we are experiencing right now, while in the moment feels unique, is actually quite normal.
PLEASE DO NOT HESITATE CONTACTING ME IF YOU HAVE ANY QUESTIONS.
** The information on this website is intended only for informational purposes. Investors should not act upon any of the information here without performing their own due diligence. Reh Wealth Advisor clients should discuss with their advisor if any action is appropriate.
A lot of the slides were take from
https://am.jpmorgan.com/us/en/asset-management/gim/adv/insights/guide-to-the-markets