
Update to the Article: 2015 Q3 Stock Market, Is it 2011 Q3 Again or 2008 Q3?
I realize that people are likely more interested in my opinion on the current market drop but I first want to revist our last market drop. I will have another article about our current market conditions soon.
Here is a link to our previous article below:
2015 Q3 Stock Market is it 2011 Again or 2008
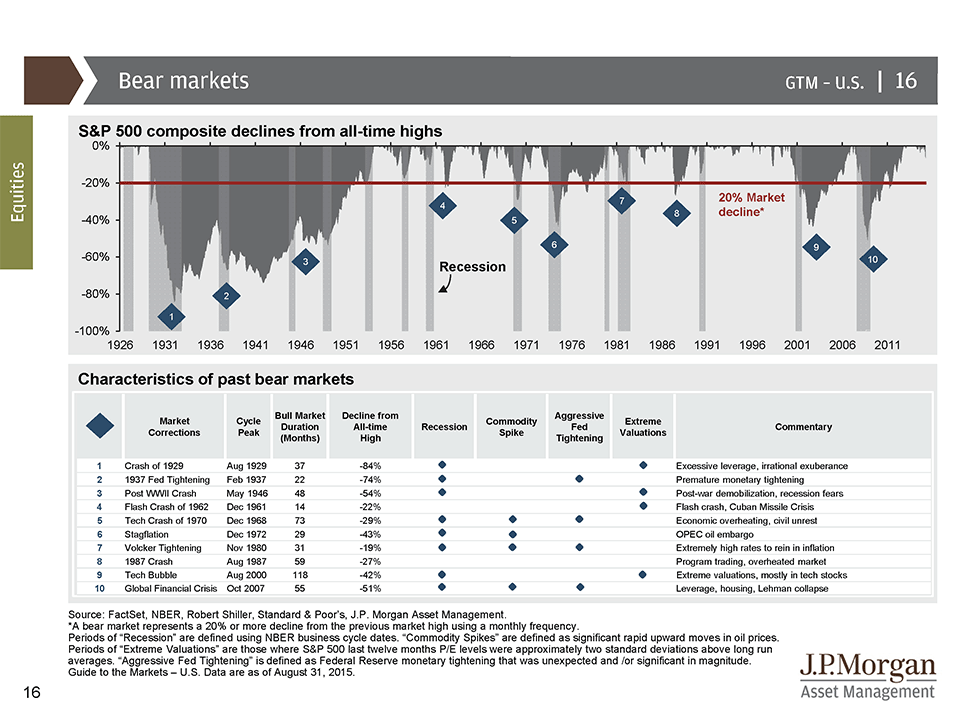
What Happened in Previous Market drops of Q3 2011 and Q3 2008?
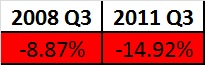
As a reminder here is the performance for the S&p500 in Q2 2008 and Q3 2011. An ugly 8.87% and an uglier 14.92% loss in 2011.
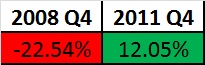
What Happened in Q4 2011 and Q4 2008?
And here is a reminder how Q4 went in both time periods.
Update – Let’s Look at 2015 Q4
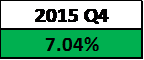
Thankfully, the 4th quarter of 2015 looked a lot more like the 4th quarter of 2011.
As mentioned previously, 2008 tended to be an anomaly in that it was one of the worst years we have experienced in the stock market; certainly it was the worst of my lifetime. Our bias is to remember things we experience and give a greater likelihood of thinking it will occur again (the phenomena is called the “Availability Bias”). The Availability Bias is the bias that is how we estimate future probabilities based on how easy it is to remember. A good example would be our current drought in Southern California. Most Southern Californians would likely overestimate the probability of future droughts based on the ease they can remember our current drought.
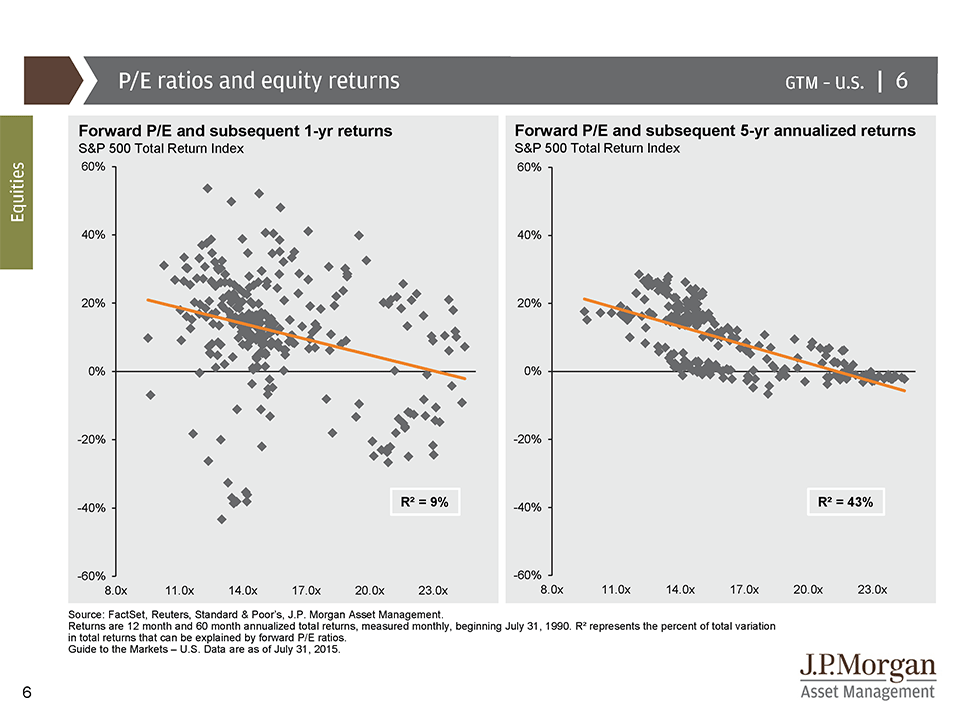
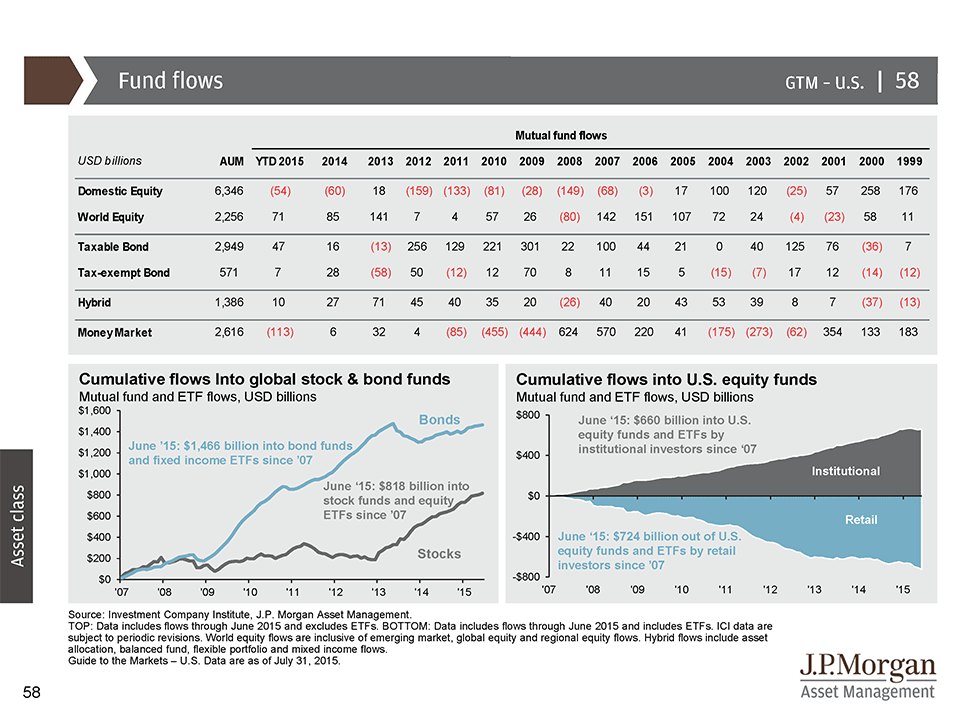
Where are we at a valuation Standpoint as of 12/31/2015?
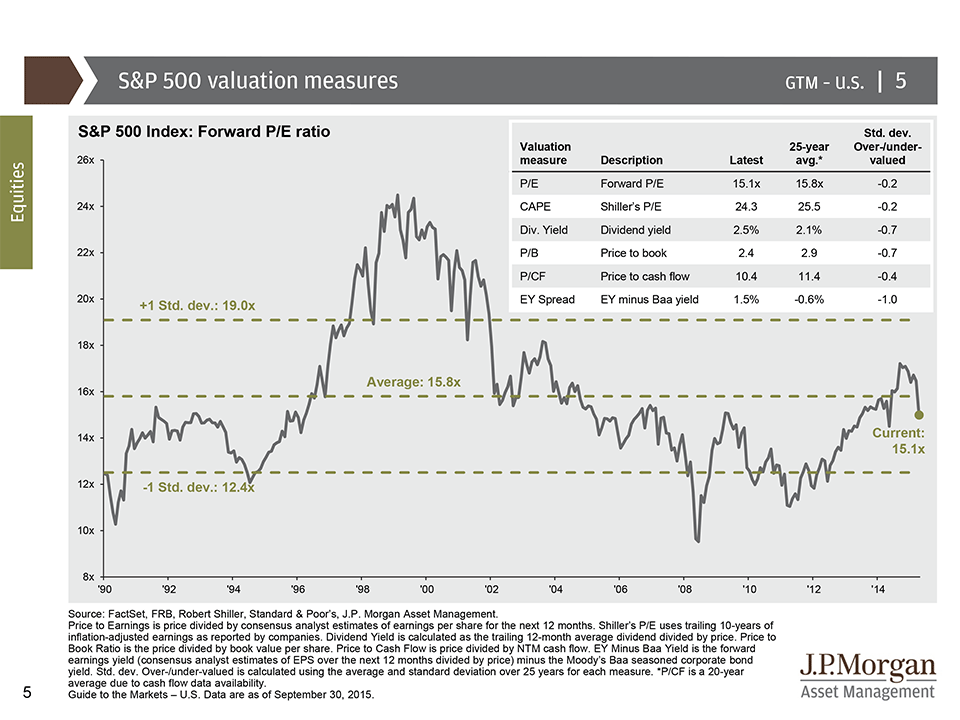
The equity market does not appear to be valued too high or too low. According to the most recent data as of 12/31/2015 in the JP Morgan “Guide to the Markets”, most measure show that the market is fairly valued.
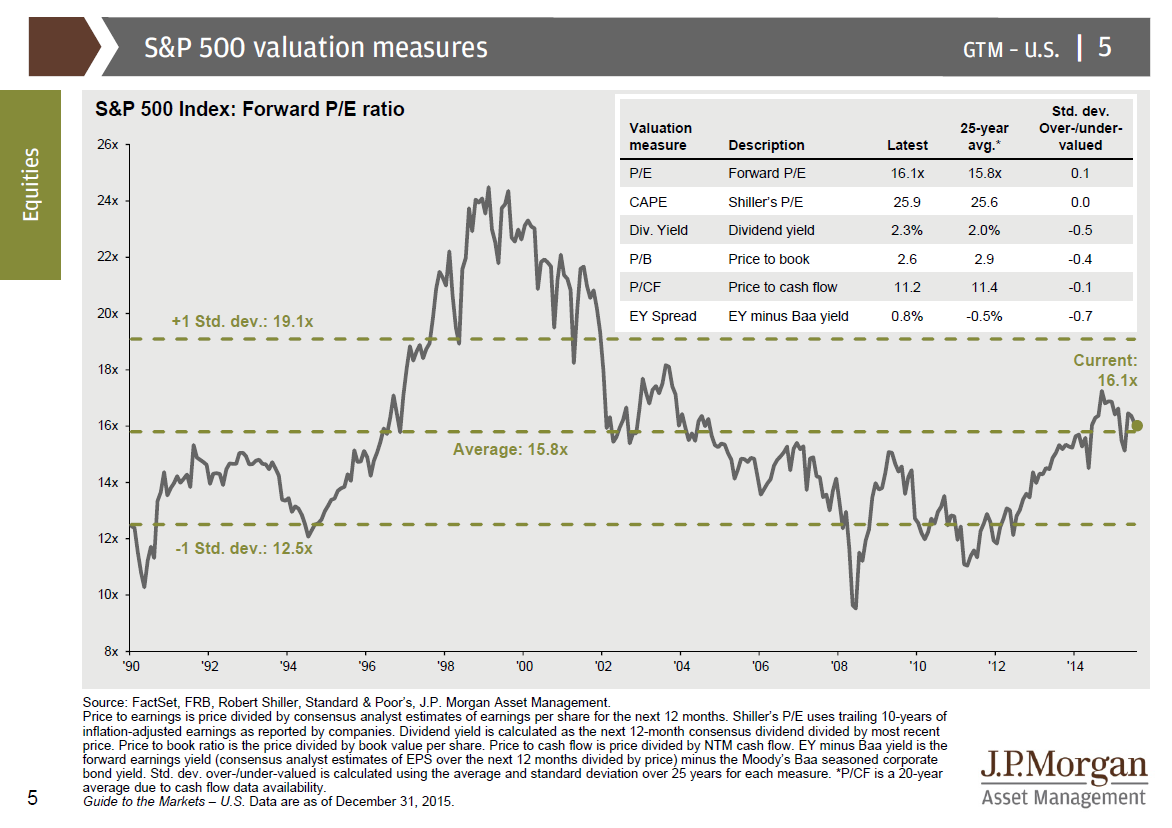
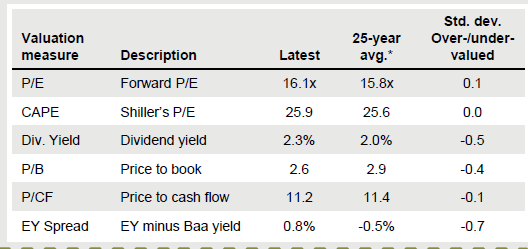
(Source: JP Morgan)
The P/E (Price to earning measure), CAPE (cyclically adjusted Price to earnings), and P/CF (Price to Cash Flow) all show a market that is fairly valued.
Dividend yield, Price to Book value, and Earning Yield less Baa Bond yield all show that the market is slightly undervalued currently.
So how do I feel about it currently? As I stated last quarter, I actually think the market is fairly valued and there is both upside and downside and I feel that our best course of action is a diversified portfolio. If valuation measure were dramatically different, I might feel otherwise.
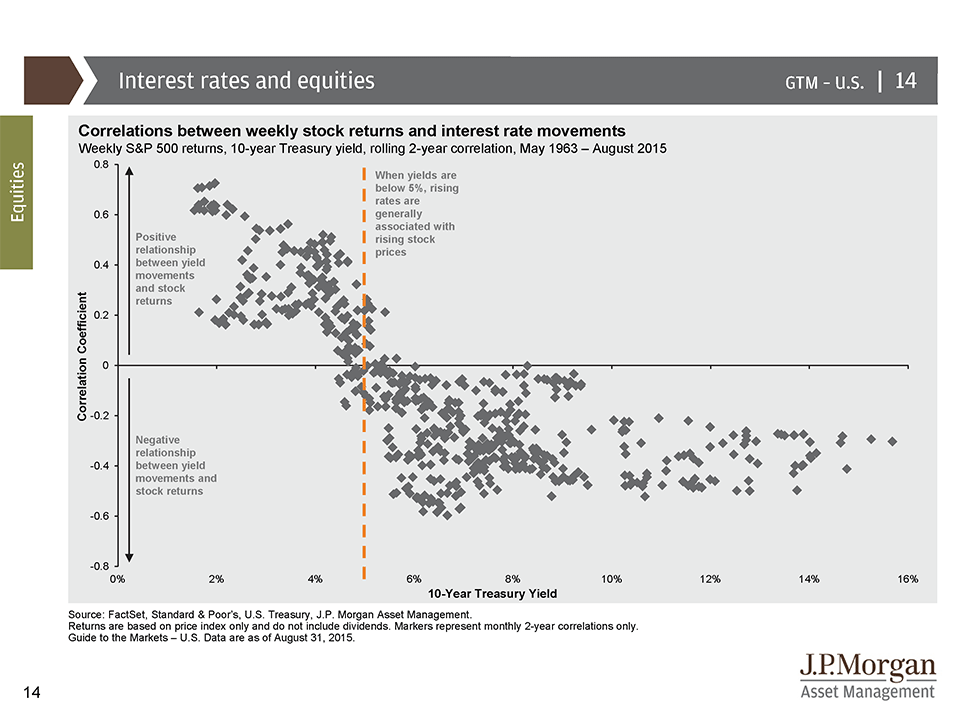
What about the Bond market with the recent Fed Rate Increase? I am worried about the bond market but I think for investors in diversified portfolios, the fear is over blown. The Fed raised rates slightly but it the impact on bond prices was relatively tame. I think the Fed will be cautious about raising rates unless inflation kicks up.
What is our takeaway?
When markets misbehave (go down), we should look at times in history to see what happened. We should look at valuation ratios to see if the market is reasonably valued. In many cases, the best course of action is to 1) take tax losses if you can 2) rebalance if you are too far from your model 3) Trust your asset allocation and risk to prevent you from performance chasing.
** The information on this website is intended only for informational purposes. Investors should not act upon any of the information here without performing their own due diligence. Reh Wealth Advisor clients should discuss with their advisor if any action is appropriate.