2015 Q3 Stock Market is it 2011 Again or 2008?

2015 Q3 Stock Market, Is it 2011 Q3 Again or 2008 Q3?

UPDATE – 1/20/2015 – We posted an article with the results of the 2015Q4 here:

2015 Q4 Update 2015 Q3 is it 2011 again or 2008?

If this past quarter’s stock market performance sounds familiar, it’s because it is.  We have experienced a similar market performance as we did in the 3rd quarter of 2008 and the 3rd quarter of 2011.

POP QUIZ – Which quarter had worse performance, 2008 Q3 or 2011 Q3?

Answer: 2011 Q3 losing 14.92% vs 2008 Q3 losing 8.87% using Morningstar’s Total US Market Index.

Q3 Comparison


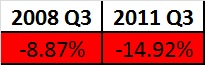
Our memory of that ugly 2008 year likely led you to believe Q3 2008 was worse but we actually had worse returns in 2011.

In 2011, we heard story after story about how were were entering into a recession and that investors and how the market was just starting its tumble.   What were the headlines in 2011?

  • Sovereign debt crisis in particular Greece was first and foremost on the news cycle
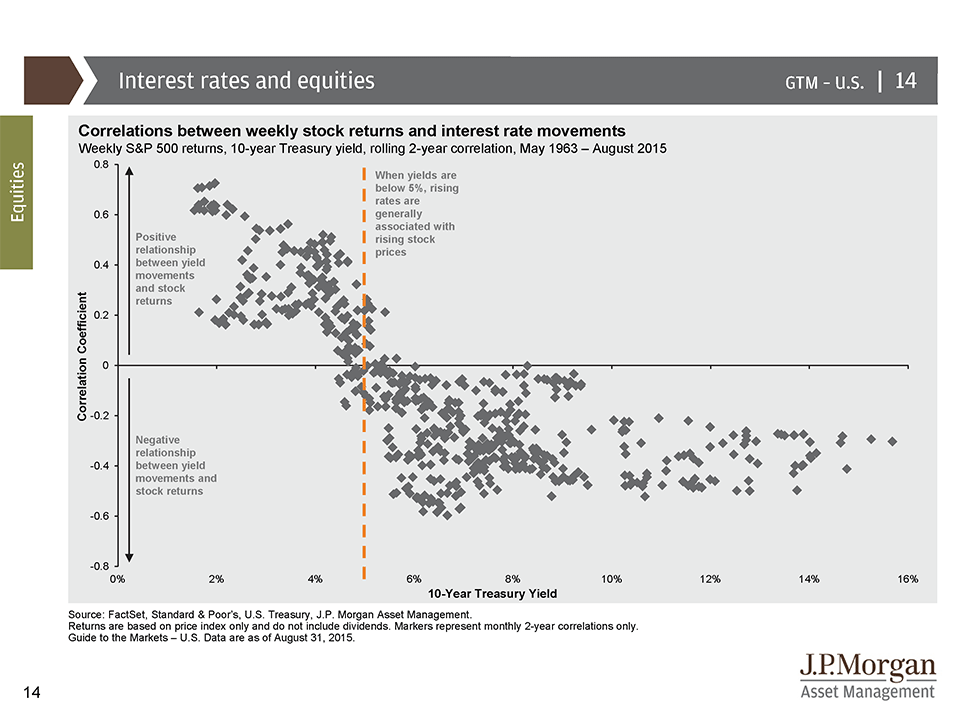
  • Bond Bubble’s were prominent headlines and fears of the Fed Raising Rates
  • Media Commentators were comparing the bankruptcies of Lehman Brothers and Bear Sterns during the financial crisis and  to Greece, Portugal, Spain, and Ireland and trying to correctly predict a huge market correction.
  • It was difficult at that time to find good financial news anywhere.

What did we say at the time?  Quoting our Quarterly Commentary in Q3 2011 appears appropriate to review:

Recession Looming?

The truth?  No one really knows where the economy is headed.  The stock market is currently pricing in a slowing of the economy and uncertainty in Europe.  If the fear causes consumers to pull back their spending, we could quickly see another recession. 

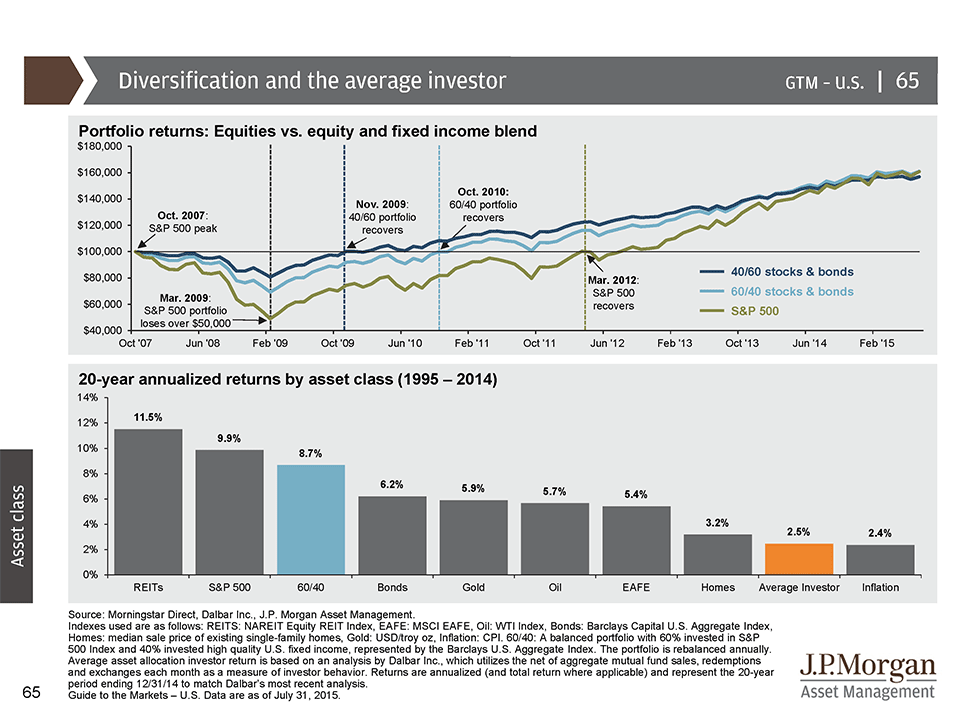
In 1975, the temptation of market timing was as prevalent as is it is today.  William Sharpe performed statistical analysis of how often a person would have to be correct in order to make money through market timing.  Through statistical analysis, Sharpe demonstrated an investor that can be 100% stocks or 100% cash would have to be correct over 74% of the time to make more money than buy and hold.

Furthermore, Morningstar looked at mutual fund inflows and outflows to determine how effective investors were at timing their purchases.  In US Equities, the average investor earned 0.22% while the average fund over that time period earned 1.59% (http://news.morningstar.com/articlenet/article.aspx?id=325664

).  This data shows that investors typically are poor market timers and tend to “sell low” and “buy high”.


What Happened in Q4 2011 and Q4 2008?

Q4 Comparison


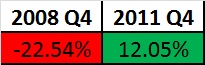
Q4 2008, would go on to become one of the worst on record while 2011 Q4 would snap back and for the year, 2011 would be in the green.

What is the lesson here?  After a drop like we have experienced this past quarter, its important to recognize that both outcomes can occur.  The market can get worse or it can get better.  Further, it will likely get better or worse more quickly than we can realize or react to.  These two moments in our history show how difficult it can be to time the market.


Any Similarities Now to Q3 2008 or Q3 2011?

Right now the stories seem to dominate:

  • International Economic Weakness  (similar to 2011).
  • Bond Market Fears (similar to 2011)
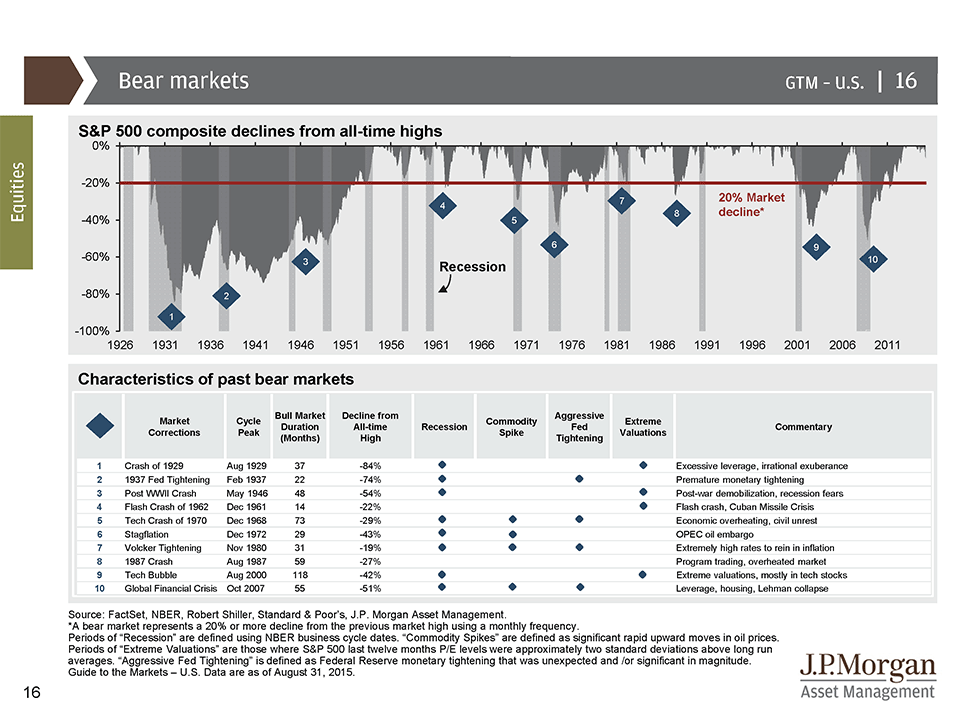
  • Recession Fears (similar to both 2008 and 2011).

2008 Q3 was most focussed on sub prime mortgages and if that was the extent of our financial crisis.  As we would find out in Q4, the financial crisis extended beyond sub prime mortgages and took the entire economy with it.

2008 was one of the worst years in the history of the stock market and historically is an anomaly.  While 2011’s Q3 was a bad quarter, 2011 more of a normal stock market year and ended slightly positive.

I am hopeful that 2015 will be similar to 2011 or at least the 4th quarter being more stable that 2008.  I am fearful that the “animal spirits” and unpredictable nature of the stock market could create another 4th quarter similar to 2008 (although in my opinion, it is unlikely).

I am going to leave you with  a quote from our 2011 Q3 Commentary which I think is appropriate now:

Outlook

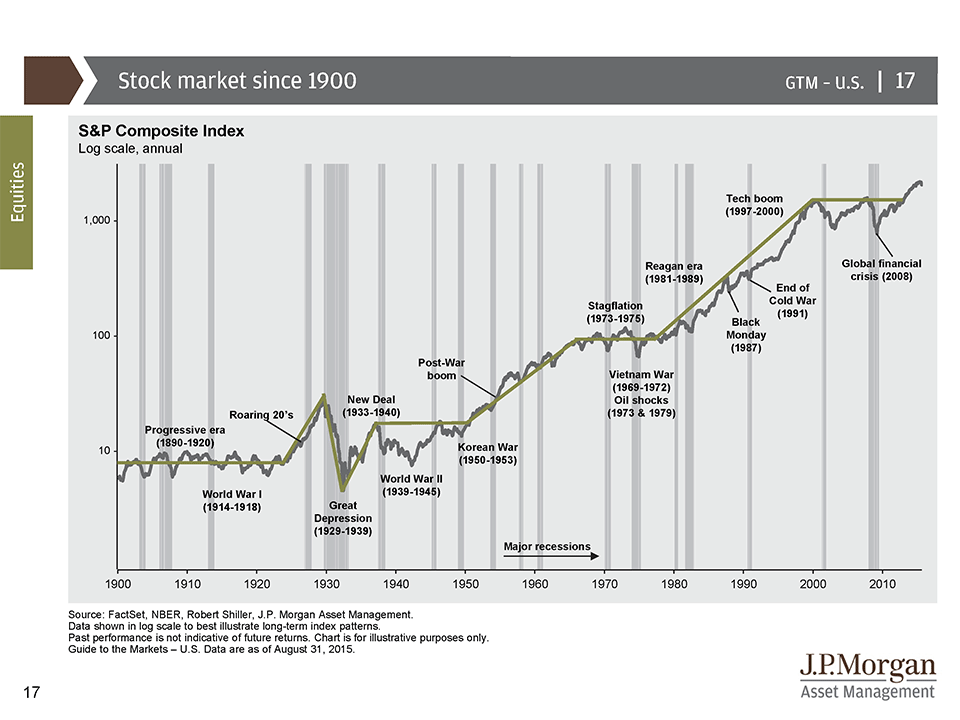
Relying on our asset allocation models will help us from letting fear or greed lead us to poor financial decisions.  It’s easy to forget that previous times in history have had just as many uncertainties as we face today.  We will end this quarter’s commentary with a reflection on decade’s past challenges:

  1. 1910’s – World War 1
  2. 1920’s – Rampant Organized Crime (They were so organized they actually had a national convention in Cleveland Ohio December 5th 1928)
  3. 1930’s – Great Depression
  4. 1940’s – World War 2
  5. 1950’s – McCarthyism and the fear of America being infiltrated by communists
  6. 1960’s – Vietnam and the Bay of Pigs
  7. 1970’s – Watergate Scandal, Stagflation, Oil Crisis
  8. 1980’s – Mexican Debt Crisis, Chernobyl Nuclear Reactor Leak
  9. 1990’s – Gulf War, Oklahoma City Bombing, World Trade Center Bombing
  10. 2000’s – 9/11 World Trade Center Attack, Dot Com Bubble Bursting, Housing Bubble and Burst

Further relevant reading from our other article about the current market you might find interesting are:

https://investwithsteve.com/2015/08/stock-market-pull-back-time-to-reflect/

https://investwithsteve.com/2015/09/mythical-bears-and-more-stock-market-reflections/


UPDATE – 1/20/2015 – We posted an article with the results of the 2015Q4 here:

2015 Q4 Update 2015 Q3 is it 2011 again or 2008?

** The information on this website is intended only for informational purposes. Investors should not act upon any of the information here without performing their own due diligence. Reh Wealth Advisor clients should discuss with their advisor if any action is appropriate.

Fed Keeps Rates Steady

interest rates -Fed Holds Steady

Despite Early Predictions – Fed keeps Rates Steady

The Federal Reserve chose to keep rates steady at 0.25%.   The Federal Reserve has telegraphed a rate hike for a couple years now preparing investors.  The Fed has kept its message pretty simple.  When it feels the economy is strong enough, it will raise rates.

Does That Mean That The Fed Doesn’t Think The Economy Can Handle a Rate Hike?

Yes and no.  In my opinion, the Economy both domestically and globally is not on as firm of ground as the Fed anticipated.  Having come out of a financial crisis in 2008, the Fed has also indicated that they are much more comfortable fighting inflation than deflation.  Their preference appears to be they would rather raise rates a little too late than too early.  The Federal Reserve has a long history of using interest rates to fight inflation.  To be honest, fighting deflation during the financial crisis had very little experience to rely on and involved several more controversial measures such as QE (and all the version of it).  Chairman Ben Bernanke face immense criticism primarily because there was no playbook for monetary policy that was proven after rates were lowered.

Will the Fed Raise Rates in October or December?

In my opinion, the primary factor will be how comfortable the Fed is with the economy.  I would also be hesitant to take to much of what the Fed is saying right now.  The Fed does not want the market to think rates will stay low for a prolonged period of time.  If the Fed signaled that, investors would increase their risk taking.  The Fed prefers at this point to have us investors think a rate hike is around the corner and when or if the economic data comes in weaker than expected, the Fed can delay what most investors have come to expect, the “inevitable” hike.

Anything New or Unique is this most Recent Fed Meeting?

While it should not be to big of a surprise to most investors, the Fed indicated while evaluating the U.S. economy that it also looks a the global economy.  The Fed basically said the were concerned the weakness is the Global Economy could spread to the U.S.  So part of the evaluation of the U.S. economy was how vulnerable the U.S. economy would be with a rate hike versus the remainder of the world.  This fact should not be too surprising.  The rest of the world has slowed down and many countries have devalued their currencies.  The devaluation causes the dollar to strengthen as we have seen.  Usually, a rate hike will also cause the currency to strengthen.  The Fed may have been looking at how much the Dollar has strengthened and adding adding pressure of another rate hike, may have caused them pause.

Going forward, it does appear that the Fed will be unlikely to raise rates on the U.S. economy unless either the U.S. economy strengthens further or even just the Global economy strengthens.  Absent both improving, we may be waiting longer for a rate hike.  Further, I would expect a more “global” Fed going forward.  While the mandate is specifically domestic in nature, I do expect to see the Fed looking globally for clues as our economies become more intertwined.

What Should Be My Takeaway?

A see a couple things important for investors to understand:

1) Predicting interest rates over the short term is very difficult.  Most experts were predicting a hike by this past June and we may not even see on in 2015 at all.

2) If there is a hike, that likely means the economy is on firm footing or that the global economy is stronger.  Our domestic and foreign stock returns would likely reflect this strength with good returns.

3) If the global economy continues to weaken or if the U.S. economy starts to weaken, our stock portfolios will likely suffer.  However, the Fed will be unlikely to raise rates and our bond portfolios would likely do well.

For these reasons, we invest in bonds and stocks and their complimentary nature allows us to build risk adjusted portfolios that match our goals.   Further, market timing of the stock market and the bond market is very difficult so we continue to rely on our diversified portfolios to weather either potential outcome.


** The information on this website is intended only for informational purposes. Investors should not act upon any of the information here without performing their own due diligence. Reh Wealth Advisor clients should discuss with their advisor if any action is appropriate.

Image by Stuart Miles at FreeDigitalPhotos.net

Mythical Bears and More Stock Market Reflections!

Mythical Bears and More Stock Market Reflections!

After our previous article:

Stock Market Pull Back Time to Reflect

Our clients have asked for more analysis.   I continue to use JP Morgan’s top notch resource for market and economic data in easy to digest slides.

Myth 1 – Market is going to drop because interest rates are going up.


False, as the chart below shows, when 10 year treasury yields are below 5% the stock market actually is positively correlated and rising rates are associated with rising stock prices.  This fact actually makes sense.  If the market is tanking, the Fed will be unlikely to continue to raise interest rates.  Whereas a market that continues to rise despite the Fed raising rates will cause the Fed to continue to raise rates until it reaches the tipping point where rates begin to hurt growth.  It should not no surprise the number is 5% as inflation is typically in the 4% range.

Interest Rates and Equities

Myth 2 – Companies are fragile and are poised to drop in value


False, Corporate cash is at an all-time high as a % of assets, dividend payout ratio is increasing but not at an unsustainable level, capital expenditures and acquisitions are on the rise indicating businesses feel good about the future.  So even with dividends increasing and share buybacks increasing, cash on the companies balance sheet has continued to rise.

Deploying Corporate Cash

Myth 3 – Bull Market has run for 7 years, we are due for a major correction

While it has been a long bull market, we typically call a bear market a 20% drop in the stock market.  We have had several recessions that have not resulted in a bear market (as shown by gray areas in chart below).  For example, from 1946 1961, there was 15 years between bear markets.   From the 1987 market crash until the tech bubble bursting we had 13 years.

Further, most bear markets have coincided with multiple factors affecting.  For example, a recession, commodity spike, and aggressive fed tightening were all factors leading the bear market of 2008.

Lets examine these factors now:

  • Recession – currently profits and sales are relatively strong but we certainly can dip into a recession.
  • Commodity Spike – The exact opposite is happening as energy costs and commodities prices have dropped dramatically.
  • Aggressive Fed Tightening – The fed does want to raise rates but they are being far from aggressive. The latest indications are that they are being tentative in raising rates as they weigh economic data.
  • Extreme Valuations – As we discussed in our previous article, valuation seem to be reasonable and not out of character.

So currently, the only factor that does concern me is the possibility of a recession and even if we have a recession, does not mean we will have a bear market where we lose 20%.

Bear Markets

Myth 4 – Markets Trend up and Trend Down Over Intermediate and Long Time Periods

In the short run (less than a year), markets go up and down and can seem like they are as likely to go up 20% as down 10%.  However, over a very long period of time, the market has trended up.  Over intermediate periods of time, the market has trended up or been a sideways market.  A sideways market is one where it oscillates with no clear trend.   The graph below illustrates its better that our memory of the dot com bust and 2008 financial crisis.

The lack of a downward trend in the intermediate term (5-10 years) is one of the major causes of market timing to fail in my opinion vs traditional asset allocation.  In an flat market, re-balancing a portfolio to the asset allocation model will generate a modest return even when the market is relatively flat.  Marking timing a bear market and missing it during a flat market only locks in your loss, then you typically get comfortable to buy right before the next drop.  In my opinion, that is why the average investor has barely beat inflation over the past 20 years.

Market since 1900

Conclusion

Please note that I am not a perma bull that thinks the market will always go up and always get double digit returns.  However, I firmly believe when investing in intermediate and longer time periods it’s important to look at these facts and realize that bear markets are a “cost of investing” because that is the risk of investing.  Further, we need to look at information and reasons we hear in the financial media to see if it makes sense and is a legitimate concern.  Currently, I do not see major red flags for a huge bear market.  That being said, bear markets are rarely correctly forecasted and the same people rarely are correct without several false positives in between.

Stock Market Pull Back – Time to Reflect

Stock Market Pull Back, Time to Put Pull Backs in Perspective

With the recent pull back, I wanted to put a few items in perspective:

1) Historical intra-year declines (pull backs)

2) Current Valuation and statistical analysis

3) P/E as a predictor of stock market performance in the short term and long term.

4) Are retail investor still trying to time the market?  Does it Work?

Annual Returns and Intra-Year Declines

The past week has been rough for the market.  The below picture shows how rough a typical year is.  The average peak decline in a calendar year is about 14%.  So while we have hit a rough patch this week, its relatively normal for most calendar years.

The average intra year decline or stock market pull back is 14%.

Current Market Valuation Measures – Hint – Market is Fairly Valued

The second slide attached shows the “standard deviation” of current vs historical valuation measures.  While they are all slightly higher (meaning the market might be slightly overvalued), the standard deviation of almost 0 indicates that the market is fairly valued and almost completely normal relative to the historical average.  The media seems to keep saying the market is over-valued lately but the statistics say otherwise.

JPMorgan 2015Q2 SP500 Valuation measure


P/E Ratio is Poor Predictor of Short Term Performance but much better at Intermediate Performance

The third slide, shows that if we look at the P/E ratio (price to earning), it is a terrible measure at predicting the next 12 months of performance for the stock market.  In statistics, the R Squared measure explains how much of the next 12 months is explained by the P/E ratio.  It comes in at a miserable 9% meaning that its useless for predicting short term performance.  Interestingly, the P/E ratio is a better measure for longer period performance.  The P/E ratio over 5 year periods helps explain 43% of performance of the subsequent years performance.  Further, at the current P/E ratio, we would expect the market to be positive and not much different than historical returns for the market.  (Current P/E is about 16.6).

2015 JP MorganQ32015 - PE and Returns

Market Timing and Why the Average Investor Loses

These pull backs often cause fear and investor might sell after a drop. Is this a real danger?

The simple answer is yes.  In my opinion, the next slide shows that the average investor sells stocks when they get scared and buys stocks when they are comfortable.  It helps explain how the average investor has managed to under perform nearly every asset class returning 2.5% and barely beating inflation which returned 2.4%.  If there is any chart that shows the danger of market timing, its the one below.

Average investor Returns


I know your next question.  You are going to ask me if investors recently have learned their lessons better?  Well, on to the next chart:

Equity inflows and Outflows from Retail Investors

Yikes!  From 2009 until 2012, the retail investor has been selling their equities missing out on much of the recent run up in the market.  In 2013, nearly 5 years after the financial crisis of 2008, the retail investor finally returned to the stock market.  Further, the retail investor has been selling their stocks and buying bonds.  Looking at institutional investors (pensions funds, endowments, etc), we see that they mostly have been adding funds to US equities as the retail investor has been selling.

So despite the relatively common knowledge that timing the stock market is difficult, retail investors continue to be late to party on bull markets, and will likely sell their stocks after the market drops, again showing that timing the market can be hazardous to your retirement goals.

Tolerating volatility is difficult and why it is critical to build a portfolio that will allow you to ride out challenging periods in the stock market.


The Take Away or Lesson from this Post?

What is our takeaway from this?  Market declines in a year are very common even in years that end up with good positive performance.  Market Valuation measures are not screaming that the market is over or under valued but rather that its a pretty boring fairly valued.  Lastly, valuation measures are poor guides for short term performance, so we should be careful about making knee jerk reactions to numbers and stories we hear in the media.

And the Final Reminder – While we try to look at markets rationally, they simply are not rationale in the short term.  If investors start to panic and start selling equities and they witness this downturn, we certainly can see a much bigger drop.  However, if the fundamentals stay strong, it should prove to be another bump in the road.  Pullbacks similar to this are healthy for the market to remind investors that the stock market is risky.


I would like to thank JP Morgan for their always excellent quarterly guide to the markets where the slides came from.

https://www.jpmorganfunds.com/cm/Satellite?UserFriendlyURL=diguidetomarkets&pagename=jpmfVanityWrapper

** The information on this website is intended only for informational purposes.  Reh Wealth Advisor clients should discuss with their advisor if any action is appropriate.

IRA Rollovers – Simple and GREAT chart from the IRS

IRA Rollovers – Simple and GREAT chart from the IRS

One major questions invstors have with their retirement plans at retirement:

Can I Roll my 401k, SEP, 403b, 457 Plan into an IRA?

Thankfully, the IRS has provided us a great Chart we can use to determine if a plan can be rolled over into an IRA.


IRS_IRA_Rollover_chart_401k_SEP_457_ROTH_SIMPLE


Source:

http://www.irs.gov/pub/irs-tege/rollover_chart.pdf

** The information on this website is intended only for informational purposes. Investors should not act upon any of the information here without performing their own due diligence. Reh Wealth Advisor clients should discuss with their advisor if any action is appropriate.

Investor Protection – The Department of Labor – Advisors Should Act in Your Best Interest – I Agree!

Investor Protection – The Department of Labor – Advisors Should Act in Your Best Interest – I Agree!

Alert_Financial_Advisors_Your_Best_InterestsThe department of Labor has an article where they are blunt about investment advice that involves a conflict of interest.  As you know, I am a fee-only advisor precisely because of the Department of Labors Concerns and:

1) I am a fiduciary that will act in your best interest

2) I LOVE being able to tell people that regardless of what investment product I recommend, my compensation does not change.  It is liberating to be able to choose the best product without regards to how I get paid.  My compensation/fee is easy to calculate, understand, and is completely transparent.  You know exactly what you are paying for.

Here is the Article:

https://blog.dol.gov/2015/02/23/what-you-need-to-know-about-retirement-conflicts-of-interest-in-3-big-sentences/

and here is a video they embedded in the article.  Please note that this video is the department of labor’s video and not mine but it demonstrate the potential conflict of interest for some advisors.

https://www.youtube.com/watch?v=dBs6H1P7Wd0

How is a fee only Advisor Different than the Video? 

Simple! We get paid ONLY the fee agreed upon by the client.  We then seek out the best pricing for the investment product we use.  We have an incentive to locate the best product for you, without the bias of how much we will get paid.

What Should You Do? Investigate if Your Advisor is Working in Your Best Interest

1) Ask if your advisor makes a different level of compensation depending on the product they recommend

2) Ask your advisor how they are paid.  If you are paying a fee, ask if that is the ONLY compensation they receive related to your accounts

3) Ask if your advisor is a fiduciary and will always act in your best interests.  In my investment advisory and financial planning contracts I am a fiduciary and am contractually obligated to act in my client’s best interest and disclose any and all conflicts of interest.


** The information on this website is intended only for informational purposes. Investors should not act upon any of the information here. Reh Wealth Advisor clients should discuss with their advisor if any action is appropriate.

Image by Stuart Miles at FreeDigitalPhotos.net.  Video from the US Department of Labor

ETF s – Exchange Traded Funds – It’s What’s Inside that Count!

ETF, Easy to understand Analogy, How are they priced, Are they cheaper?, Are they Diversified?

ETF s – Exchange Traded Funds – It’s What’s Inside that Count!

In our previous entry about mutual funds and how they are best understood as simply a “bag” that holds investment assets. (Mutual Funds Explained, “Bag” Analogy ) Today we are going to delve into Exchange Traded Funds or ETFs.  I have some good news…….

If you understood our article on mutual funds, ETF’s will be REALLY easy to understand.  An ETF is simply another bag.  Lets take our grocery store analogy.  When you get to the check-out counter,  you are asked, “Paper or Plastic”?  Does the bag really impact what you eat for dinner or is it what your put inside the bag what matters?  Of course it’s what’s inside that counts!

It’s What’s Inside that Count!

Growing up, I heard the lesson time and time again, that its what’s inside that counts.  Meaning that a person’s character is the most important feature and its important to maintain good character.  The same is true for ETF’s.  By merely being an ETF, the investment is NOT automatically superior than a mutual fund! What are the assets invested in?  The thought process and analysis is the same as a mutual fund, what does the ETF or fund invest in?  Is it diversified, what are the objectives.

How are ETF’s Priced

With ETF’s I have to be careful to avoid getting too complicated.  So we are going to keep it as simple as possible.  In general, ETF’s will trade very close to their net asset value (what all the assets/investments inside the bag are worth, check out the mutual fund bag article for a better explanation).  I thought about giving the detail reason WHY but then decided that’s an advanced topic.  Just understand that they trade very close to what the assets are worth inside.

One difference from a mutual fund is that the ETF will trade throughout the day similar to a stock.  If you want to buy an etf at 7:45AM you can.  With a mutual fund, you would have to wait until the end of the day.  I think this is a minor point/issue with ETFs.  A long term investor should not care if the trade completes at 7AM vs the end of the day.  It does however, bring up an important point about ETFs.

Some ETF’s are not as liquid (don’t trade very often), so if you are placing a large trade relative to the volume for that ETF, you should be cautious.  This danger can be viewed as a hidden cost of an ETF as the price may move to be able to complete your trade.

ETF’s have a bid/ask spread.  Similar to a stock, an ETF has a price it can be bought for and a price it can be sold for.  This fact should be viewed as a transaction cost to the investor.  Some ETF’s have larger differences between the bid and the ask and therefore cost more.

Many times when comparing an ETF vs a mutual fund, people will forget the hidden cost of liquidity and big ask spreads when comparing to mutual funds.  It’s important to look beyond the expense ratios of the two investments.


ETF’s Are not Always Cheaper!

There seems to be an assumption that ETFs are always cheaper.  Often times they are but there are times they are not.  The expense ratio for Pimco’s Total Return ETF is higher than the Institutional Share class of the Total Return Mutual Fund.  If I have access to both investments, I would pick the mutual fund because the mutual fund has a lower expense ratio that negates some of the advantages to the long term investor the ETF might have.

The Take Away

Mutual funds and ETF’s are just bags or ways to hold assets.  Look inside them when evaluating what they do and how well they do it.  Do not assume ETF’s are cheaper.  Look at liquidity and bid-ask spreads to get the full picture.


** The information on this website is intended only for informational purposes. Investors should not act upon any of the information here. Reh Wealth Advisor clients should discuss with their advisor if any action is appropriate.


Image courtesy of digitalart at FreeDigitalPhotos.net

Mutual Funds Explained, The “Bag Analogy”

Mutual Funds Explained, The “Bag Analogy”

Mutual Funds Explained, The "Bag Analogy"

Mutual Funds despite their wide use in 401k plans and by individual investors are still often misunderstood.  In this article, I hope to help you gain a greater understanding of these investment vehicles.

The “Bag Analogy”

I find analogies work well when trying to explain concepts.  I like using what I call the “Bag Analogy”.  Everyone understands what a bag is.  It can be brown bag from the grocery store, it can be a plastic bag, or it can be a duffel bag.  What is a bag’s purpose?  To hold “stuff”.

What is a mutual fund’s purpose?  To hold “stuff” (securities such as stocks and bonds).

If I told you had a brown bag, would you know what I had inside?  Could it be eggs? Golf Balls? Trash?  You really don’t know.  Similarly, if someone says I have a mutual fund.  Do you know what it invests in?  Do you know if it’s diversified?  What is its purpose?

A mutual fund can hold stocks, bonds, CD’s, other mutual funds, and other instruments.

It’s what is inside that count!

Similar to most bags, the value is what is inside.  Some mutual funds invest in stocks, some in bonds, and some in more complex strategies.  It important to understand what you are buying.

How are Mutual Funds Priced?

Open end mutual funds total up the value of all the investments owned (the “stuff” in the bag) at the  end of the day and then divide by the number of shares to come up a fair value of the price of the shares (The finance jargon for it is “net asset value”).  Let go back to the paper bag example.  Image you and 5 friends send someone to the grocery store to get groceries for dinner.  When they get back you have a bag full of groceries.  You then look at the value of the groceries (total asset value) and divide by the number of people (5 shares) and arrive at a fair price (net asset value).

The Take Away?

Understand that mutual funds are just a legal structure or “bag” that holds the investments.  The structure give you access to different investment strategies but for this article, I just want you to focus and understand that a mutual fund is mostly a structure and we look inside when making decisions about it.


Exchange Trade Funds (ETF s)- Check out our other Article

Check out my article other article that covers a similar investment vehicle here: ETF s – Exchange Traded Funds – It’s What’s Inside that Count!


Other Good Sources of information about mutual funds:

https://en.wikipedia.org/wiki/Mutual_fund

http://www.morningstar.com/

http://finance.yahoo.com/funds/

** The information on this website is intended only for informational purposes. Investors should not act upon any of the information here. Reh Wealth Advisor clients should discuss with their advisor if any action is appropriate.


Image courtesy of ningmilo at FreeDigitalPhotos.net

Beware the 3 and 5 Year Numbers: 2015 Mutual Fund Analysis (Brightscope Article by Steve Reh)

Check out the article I wrote on Brightscope regarding analyzing your investment performance this year.

Beware the 3 and 5 Year Numbers: 2015 Mutual Fund Analysis

Beware the 3 and 5 Year Numbers: 2015 Mutual Fund Analysis


http://www.brightscope.com/financial-planning/advice/article/17007/Beware-The-3-And-5-Year-Numbers-2015-Mutual-Fund-Analysis/

Summary:

  1. Most advisors evaluate manager performance through an entire economic cycle
  2. Since 2008, market performance has been mostly up
  3. 3 and 5 year performance numbers do not include a down market
  4. Place greater emphasis on the 10 year performance number to capture the entire cycle.

If you have any questions, please do not hesitate contacting me.

Thanks,

Steve

** The information on this website is intended only for informational purposes. Investors should not act upon any of the information here. Reh Wealth Advisor clients should discuss with their advisor if any action is appropriate.