
How “Safe” Are Your Bond Investments? – A Guest Article from Greg Phelps, CFP®
I want to thank Greg Phelps for his highly timely article on bonds, especially given the recent rise in rates. Thanks again Greg for your valuable contribution. If you are in the Las Vegas area looking for an advisor, be sure to look him up. – Thanks Steve Reh
 Most investors think of bonds as “safe”. The fact is bonds can be risky as well, not as risky as stocks generally speaking, but risky nonetheless.
Bonds guarantee a return of principle with interest payments. But if their return is guaranteed, why are bonds risky?
Let’s define risk for a moment. Is risk the “loss” of principal, or the “volatility” of your principal? If you define risk as volatility – which could lead to losses if you sell in a bad period – then bonds are risky because values are volatile.
Why Are Bonds Volatile?
Bond values fluctuate with interest rates in the economy. When interest rates rise, bond values fall. When interest rates fall, bond values rise.
This is an important concept, so we’ll walk through a few simple examples.
What If Interest Rates Go Up?
Key and a Stock Certificate. Key To Investing ConceptIf your neighbor bought a 10 year bond paying 3% a year ago, and similar 9 year bonds are paying 4% today – you wouldn’t want to buy his 3% bond. You’d buy a new bond with the higher interest rate.
| Purchase Date | Bond Investment | Coupon Rate | Yearly Income | Term in years |
| 1/1/2015 | $1,000 | 3% | $30 | 10 |
| 1/1/2016 | $1,000 | 4% | $40 | 9 |
Interest rates rose over that one year period, so your neighbor’s bond value must drop. His bond pays $10 less per year than a new bond after all.
Your neighbors bond value will drop in an amount which compensates a potential buyer for the reduced income (compared to what he could get today). The calculations are complex, and in the real marketplace it’s all based on supply and demand.
Some investors prefer the coupon payment. Others prefer the capital increase in value over time, and don’t necessarily need the larger interest payment. These factors affect the value on the open market.
This drop in value (also called a discount) will bring the total yield up to 4% over the life of the bond, so it matches current 9 year bond rates. The interest payment stays the same at 3%, but the capital gain between the discount paid and the bond’s maturity value compensates the new investor with a total yield roughly equal to 4%.
What If Bond Rates Drop?
Conversely, if you bought a 10 year bond a year ago yielding 5%, and rates today are 3% for similar bonds you’d be able to sell your bond for a premium. A premium means you’ll get more than for your bond than its maturity value. Your bond pays more interest to an investor than they’d otherwise get with current bonds, so you deserve a higher price.
| Purchase Date | Bond Investment | Coupon Rate | Yearly Income | Term in years |
| 1/1/2015 | $1,000 | 5% | $50 | 10 |
| 1/1/2016 | $1,000 | 3% | $30 | 9 |
These are overly simplistic examples, but they illustrate a concept. When interest rates rise, bond values drop. When interest rates drop, bond values rise.
So Just How Much Do Bonds Fluctuate?
It really depends on supply and demand in the marketplace. This is determined by perceived current and future risk, and most of this risk is in the form of time.
Some bonds mature in the short term, such as a year or two. Some mature in the intermediate term, for example 5 years or so. Some are long bonds and mature in 20 or 30 year. The longer the bond’s maturity, the more they drop in value when rates rise, and the more they rise in value when rates drop. This volatility is measured by “standard deviation”.
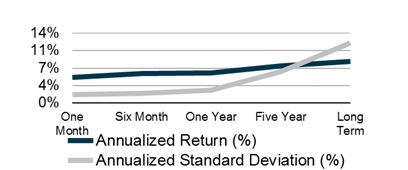
Bond Returns And Risk[1]
| One-Month US Treasury Bills |
BofA ML Six-Month US Treasury Bill Index |
BofA ML One-Year US Treasury Note Index |
Five-Year US Treasury Notes |
Long-Term Gov. Bonds | |
| Return | 5.19% | 5.91% | 6.08% | 7.52% | 8.31% |
| Risk | 1.66% | 2.01% | 2.55% | 6.34% | 12.14% |
The longer your bond portfolio’s maturity, the more risk you have in holding those bonds. There’s a point at about 5 years when the risk really starts to spike.
The question becomes “at what point is the volatility with your bond portfolio too high?” In other words, if you’re investing in longer term bonds for the yield, you’re likely taking a lot of volatility risk. There comes a point when the risk of long term bonds can rival some stock investments.
Bonds For Stability
Most investors buy bonds for yield when in fact they should be buying bonds to provide portfolio stability, like ballast in a boat. Ballast provides ship stability when the weather gets rough… and trust me the markets will get rough!
The total return from a portfolio is far more important than the returns generated from any individual investment in the portfolio. Even though shorter maturity bonds pay less interest, the easiest way to reduce portfolio volatility (assuming you’ve reduced your exposure to stocks first) is to reduce bond maturity.
About The Author
Greg Phelps, CFP®, CLU®, AIF®, AAMS® is the President of Redrock Wealth Management, a fee only fiduciary advisor in Las Vegas. Greg has been a financial planner for over 20 years, and specializes in retirement wealth management for baby boomers. He’s also the founder at RetireWire.com – a retirement financial and money management blog.
[1] Data calculated (or derived) based on data from the CRSP US Stock Database ©2014 Center for Research in Security Prices (CRSP®)