Today (2/24/2019) the Corona Virus impacted stock markets driving market indexes down more than 3%. Fears of the impacts of the virus results in a relatively large one day drop for the stock market. I wanted to review past Epidemics to help calm investors and understand the risks to their portfolios and the most prudent action going forward.
Is it Time to Panic?
The simple answer is no. The panicking investor has rarely been rewarded. Right now is the time to look at history and review the results. Market Watch has a great article that shows the past results of similar health scares. https://www.marketwatch.com/story/heres-how-the-stock-market-has-performed-during-past-viral-outbreaks-as-chinas-coronavirus-spreads-2020-01-22
Past History lessons of Health Epidemics with the US Stock Market
| Epidemic | Month end | 6-month % change of S&P | 12-month % change of S&P |
| HIV/AIDS | June 1981 | -0.3 | -16.5 |
| Pneumonic plague | September 1994 | 8.2 | 26.3 |
| SARS | April 2003 | 14.59 | 20.76 |
| Avian flu | June 2006 | 11.66 | 18.36 |
| Dengue Fever | September 2006 | 6.36 | 14.29 |
| Swine flu | April 2009 | 18.72 | 35.96 |
| Cholera | November 2010 | 13.95 | 5.63 |
| MERS | May 2013 | 10.74 | 17.96 |
| Ebola | March 2014 | 5.34 | 10.44 |
| Measles/Rubeola | December 2014 | 0.20 | -0.73 |
| Zika | January 2016 | 12.03 | 17.45 |
| Measles/Rubeola | June 2019 | 9.82% | N/A |
| —Source: Dow Jones Market Data |
Note: I borrowed that table and information from the marketwatch article.
As we can see of the 12 previous epidemics, only one had a 6 month negative return for the S&P500 (HIV/AIDS 1981 0.3% Loss). Only two epidemics had negative returns over the next 12 months (HIVE/AID 1981 16.5% loss, and Measles/Rubeola 2014 with a nearly flat 0.73% return).
World Stock Market Impacts

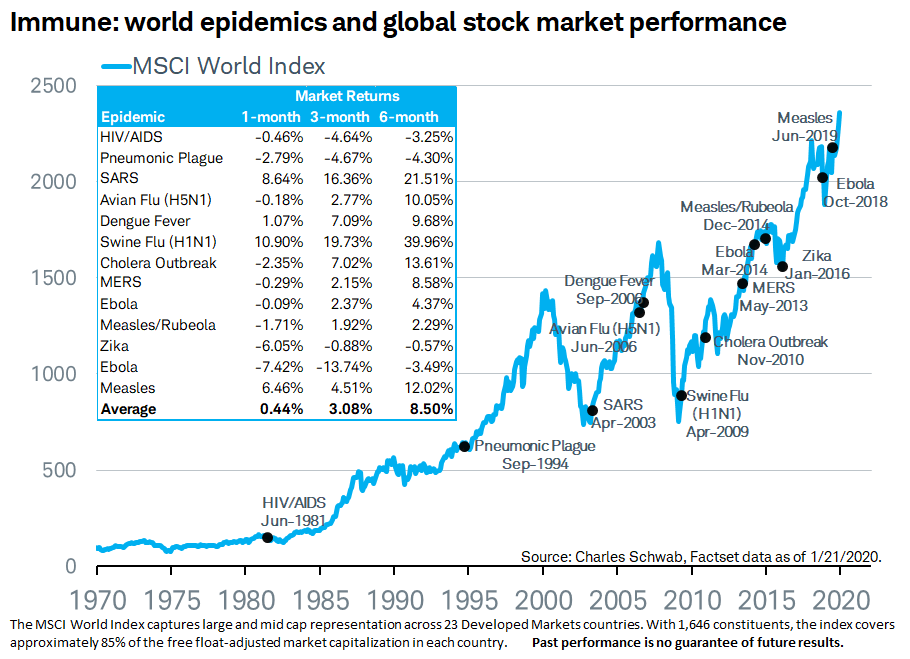
The above chart I also took from the market watch article. This chart shows the world market return as many of these epidemics started outside the US. As expected, the performance was worse than the US market, however some interesting findings are there.
- Average returns are not just positive over the 1 , 3, and 6 month periods, the 6 month average return is an impressive 8.50%
- 9 of 13 periods showed a loss over a 1 month period
- 4 of 13 showed a loss over a 3 month period
- The same 4 epidemics showed losses over the 6 months period, with losses of 3.25%, 4.30%, 0.57%, and 3.49%. In all cases, these 6 month losses are fairly tame.
Conclusion – Epidemics historically have had minimal risk to portfolios
While its always possible “this time is different”, history has show us that epidemics are likely the least cause for worry for our portfolios. The fear is that we could have another black plague that devastated Europe and Asia in the 1300s that killed 20 million people in Europe (1/3 of the population). However, modern sanitation and public health practices has mitigated the black plague. The combination of modern medicine, health practices, and modern sanitation greatly reduce the odds of another mass plague.
So while the Corona Virus is scary, the odds are your portfolio should weather this threat well. While we cannot predict the future and the risk that “this time is different”, the past epidemics in modern times have had minimal impact on portfolios. As is usually the case, maintaining market risk/exposure is the prudent course of action and the calm/patient investor will most often be rewarded.
** The information on this website is intended only for informational purposes. Reh Wealth Advisor clients should discuss with their advisor if any action is appropriate.
